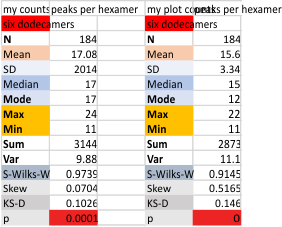
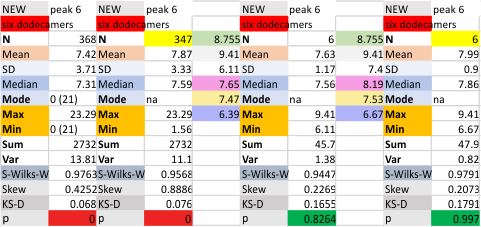
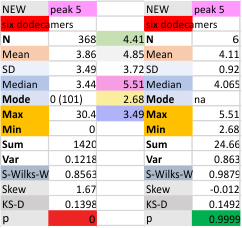
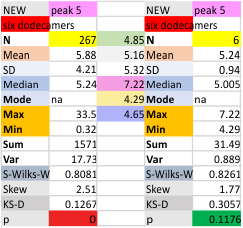
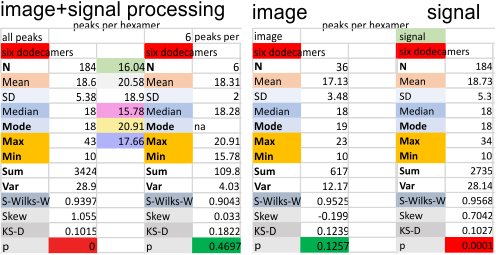
Six dodecamers: SP-D – peaks numbers for trimers, hexamers, with and without signal processing — this data compare the counts of non-processed peaks along a hexamer, with counts of peaks along hexamers which have been 1) image processed or signal processed, or 2) both.
Each procedure i have maintained with its processing settings (for both image and signal processing). Unprocessed images record more peaks that are less likely to actually be meaningful because it picks up individual pixel values which are not always meaningful.
This seems not to be totally alleviated by the use of signal processing scripts. Some identify peaks that are almost too small to measure, worse than picking up pixels. Since the difference between what is found with image processing (that would be counts from the original plots in imageJ, and my counts from the actual micrograph before any image processing has been made) and also before the image was subjected to any peak finding programs seems to end up a pretty small difference.
This was confirmed by sorting the two sets of data out into “image” and “signal processed” and I had hoped the peak number found in each plot would be greater in the signal processing apps. Thus i could rationalize it as a way to avoid processing and recording a huge numbers of grayscale plots with signal processing, and rely more on what my own educated guess says about how many bright peaks there are in the four domains of the structure of surfactant protein D.
But there is little consistent difference between the two approaches much to my dismay, the numbers both ways are pretty close. Maybe both, though are an over-estimate of peak numbers. My personal feeling is that earlier data (15 peaks per hexamer with the odd peak being central N termini junction peak in the hexamer molecule) was a good number, but these last observations are higher.
It is also, I have found personally true, that the settings (lag threshold, influence, smoothing etc) are all really individually set…. and while i chose to use the same settings on all micrographs of these SP-D dodecamers (out of focus, light, too much or too little contrast, torn and scratched, lying over debris or other molecules) I could have selected options that made them all fit the way I wanted….. this is disconcerting, as i hoped that signal processing would be the perfect unbiased count…
NOPE. This is a way i had hoped to elimate bias…. but if i change setting on signal processing, i feel it is “bias”,
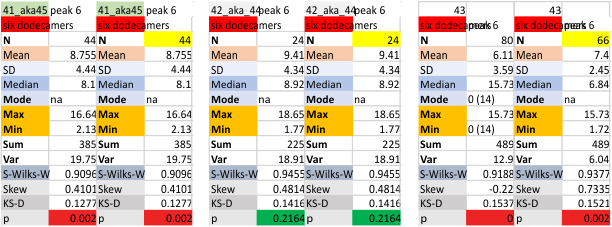
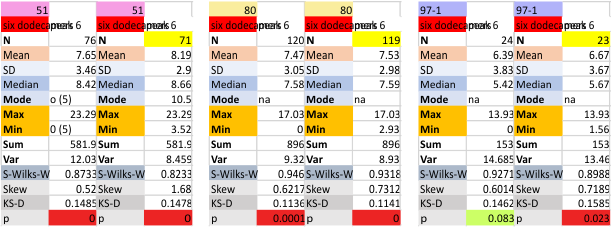
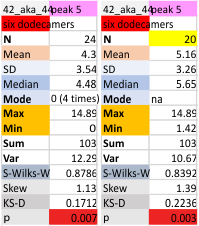
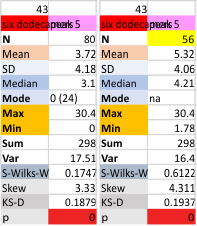
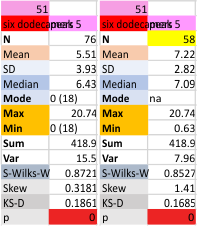
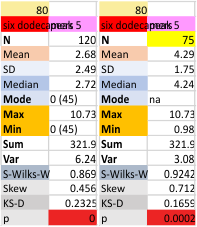
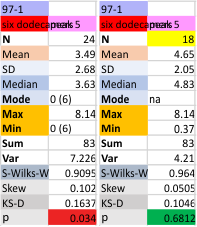
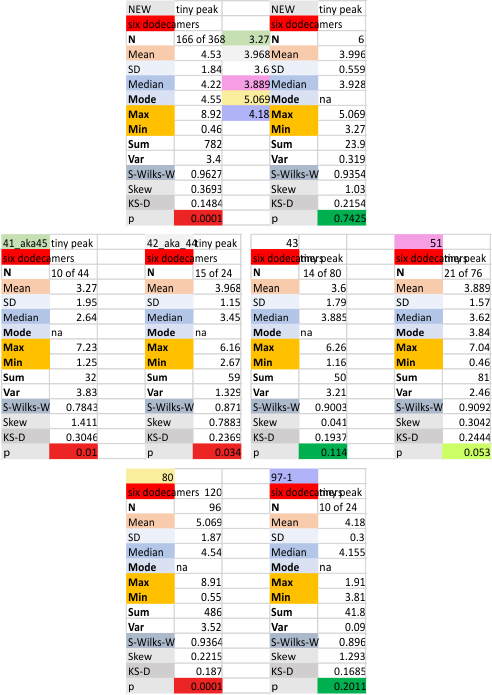
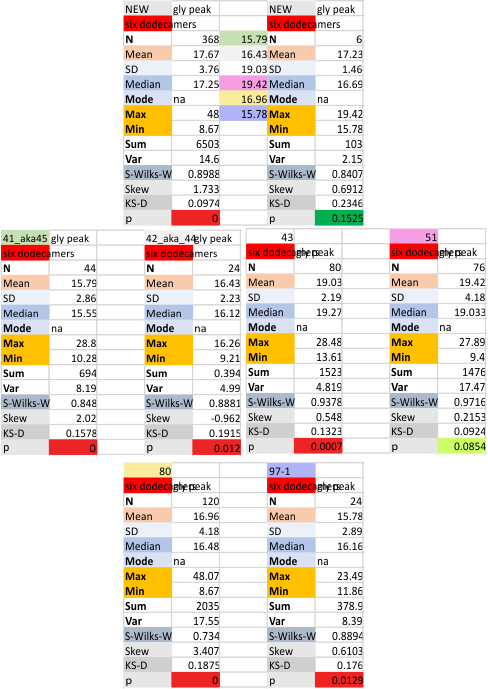
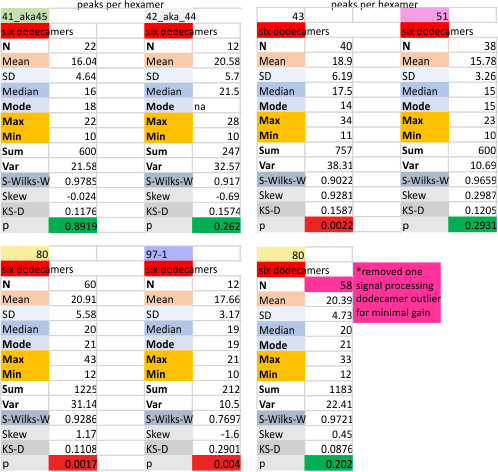
Measures for the 6 individual dodecamers are below( numbers of peaks per each of the two hexamers are listed separately) and from one hexamer ( 80) i removed the hexamer that was suggested to be an extreme outlier using an online statistics calculator for skew. That said, virtually no difference in the mean was seen.
 I sense that 15+/- 2 will be the number of consistently found peaks in a hexamer.
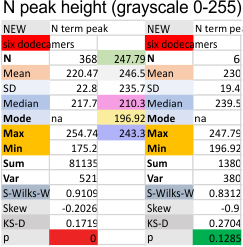
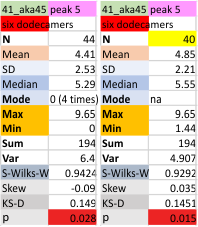
Found yesterday, 5 peaks per trimer (or 9 peaks per hexamer) are noted about 100% of the time. There are three other peaks present at about 40 60 and 70% of the time that are still in question.
My counts from micrograph and my counts from the original grayscale pleak plots.