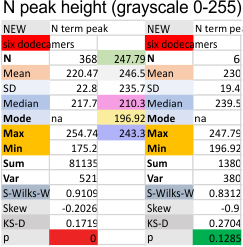
Same procedure, N termini junction peak height for a selected data set (n=368 trimer plots), for the mean of the select 6 dodecamers (all plots each of the dodecamer images of SP-D). The grayscale values of the individual images, does make a difference in the peak heights…. whick at some point i will try to normalize. But for now, the N termini peak has always, and continues to be the highest peak in the plots, typically close to center (there are very rare exceptions which can be attributed to overlapping molecules in an image.
With an extensive number of plots of the first four dodecamers, the grayscale peak was 238.6 +/- 3.75, so the fourth and fifth dodecamers added did change this number slightly. Clearly the values are influenced by the contrast of each image. I think a “limit range” function (which can be found in Gwyddion and likely other programs for image analysis) could be useful. I am more interested in a quick normalizing of peak height and the lowest point in the plot using a graphics program.
(I continue to thank Arroyo et al, and Thomas O’Haver and my two sons, Aaron and Dan for help with image and signal processing apps.