Category Archives: surfactant proteins A and D

Fun with Copilot — SP-D dodecamer – no where near reality

Fun with Copilot — SP-D dodecamer — no where near reality:
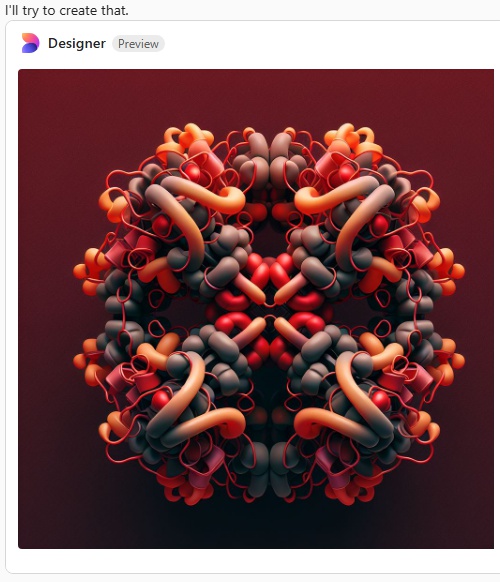
I asked Copilot to generate an image of a Surfactant protein D dodecamer as seen by atomic force microscopy thinking that the image that have been published, mainly by Arroyo et al, would have sparked some kind of realistic image, first pop, here is what came up. Not atomic force microscopy but some kind of conglomeration of a molecular model.

a surprise to say the least, not partiularly a good surprise.  Looks like dredlocks to me.

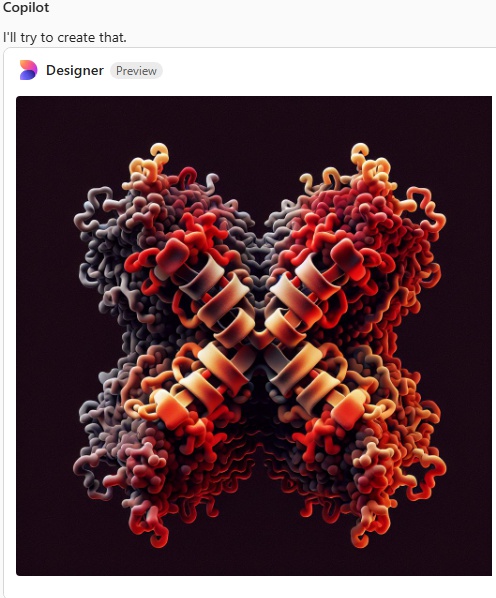
I adked again mentioning that I didnt want a ribbon molecule of just the carbohydrate recognition domain, to please try again. I mentioned that it had three trimeric arms, and was shaped like an X.

Try 2 with Copilot was not much closer to the images actually shown with AFM.

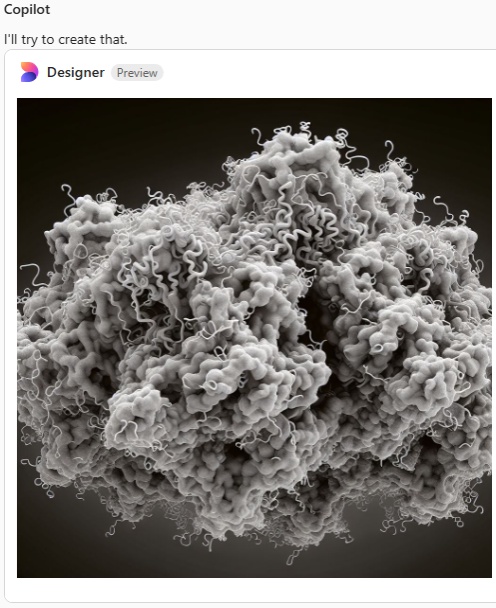
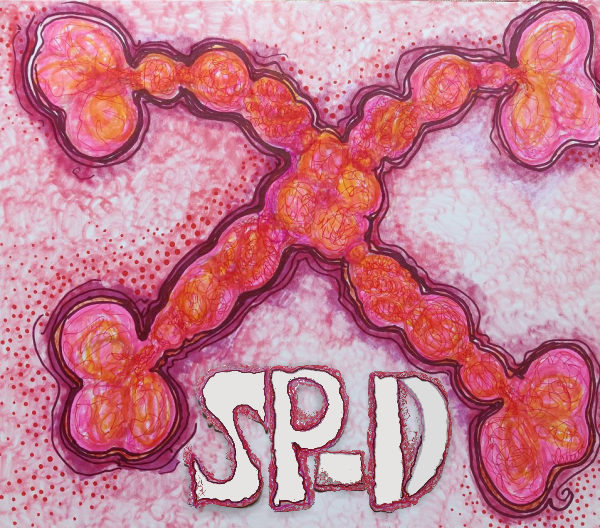
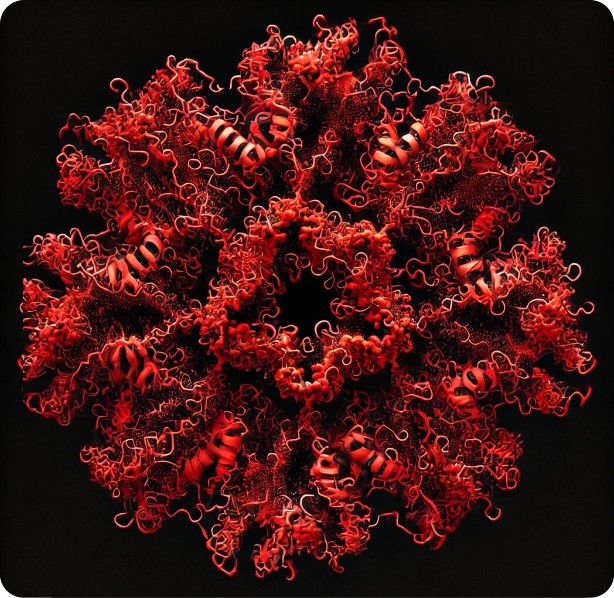
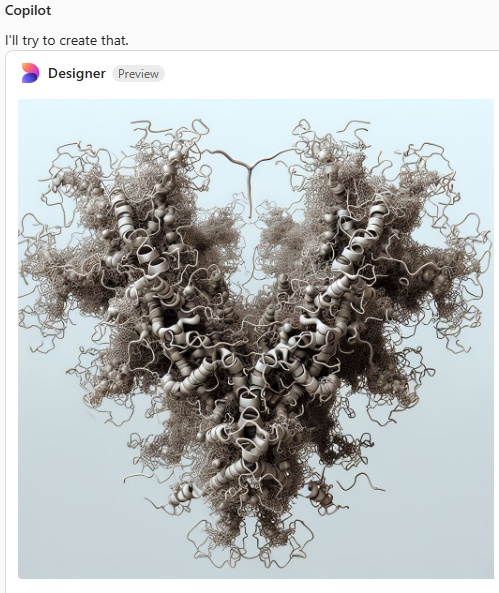
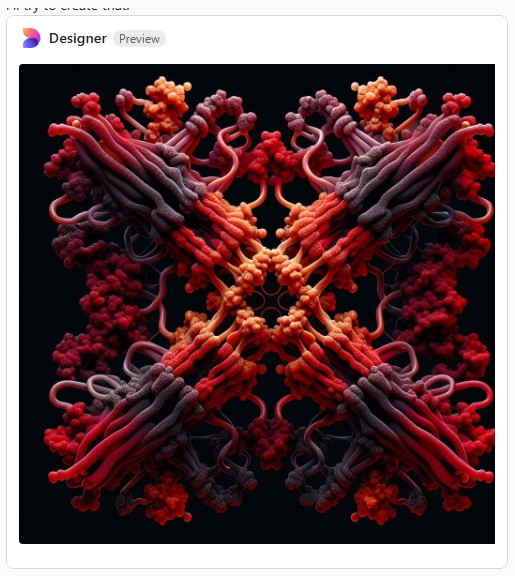
Try 3. This time i mentioned that most atomic force micrographs have an orange, deep red, and bright yellow coloring, and the the arms of the SP-D dodecamer were long, and here is what was generated.

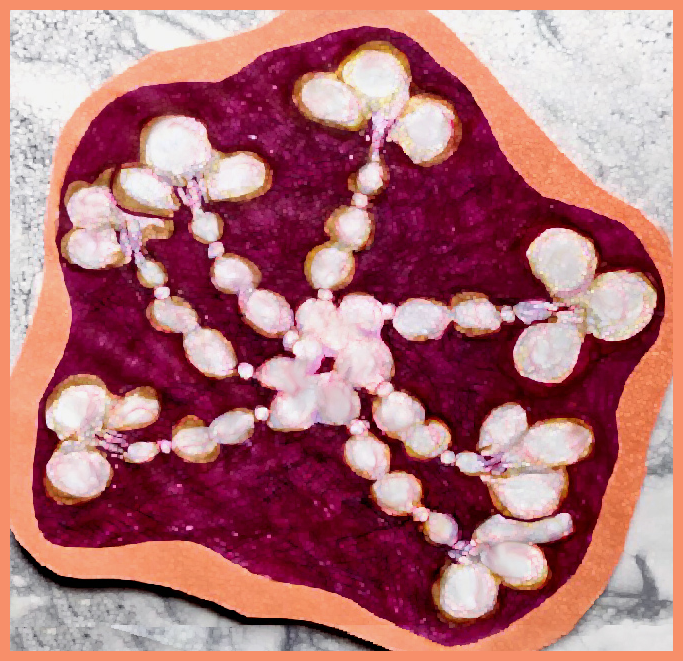
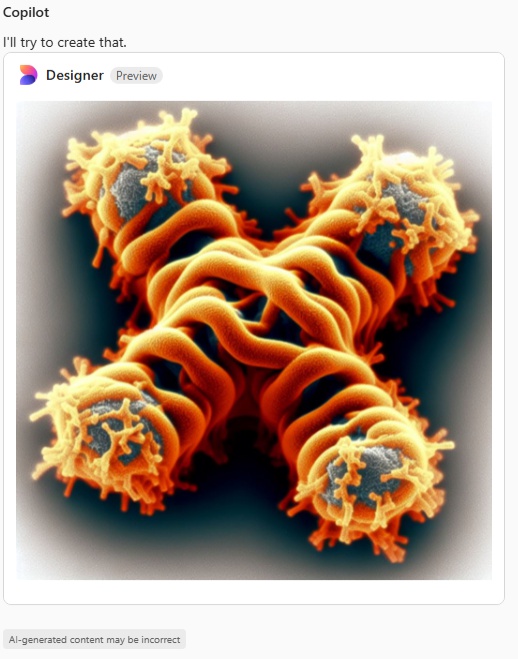
Try 4.  I mentioned that the arms were not wide on the dodecamer, and that the N termini were joined together in a bright peak in the center of the dodecamer, and here we have —

I am a little surprised that since there are so many image of the SP-D X shape, and so many references to the alpha helix in the neck (and adjacent collagen like domain) that this image still looks like a form of spagetti.  I am pretty sure i mentioned that the trimeric arms were identical which apparently Copilot did understand.

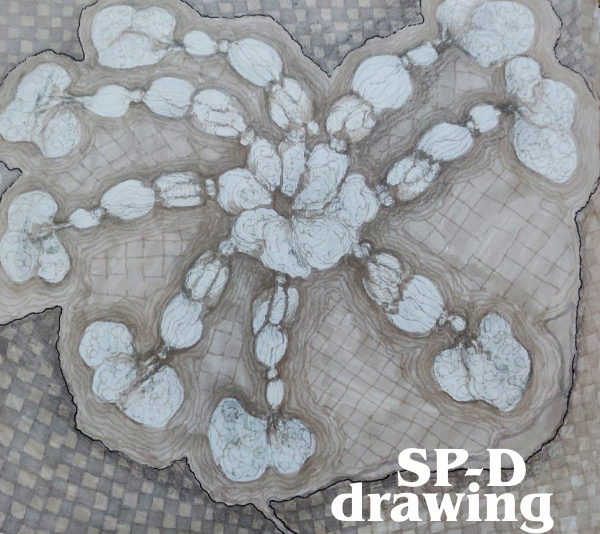
Try 5.  Arms are indeed a little thinner but there is nothing at all that looks like an alpha helix, and totally missing is any appearance of the three carbohydrate recognition domains that flop around as the three C term elements of the trimer….  that also is open information in terms of molecular models and diagrams.

Try 6.  This made me laugh, and it also must have frustrated Copliot, cause that was the end of the exploration, I guess I had used up to much valuable time.  LOL,  this looks like something from a restaurant that sells gourmais deserts.

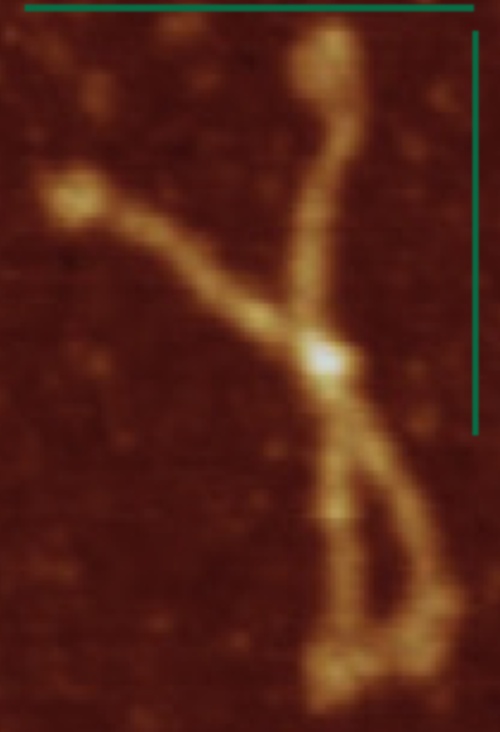
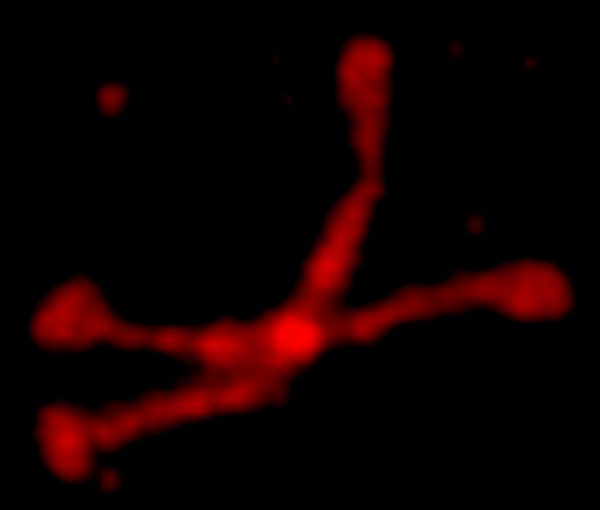
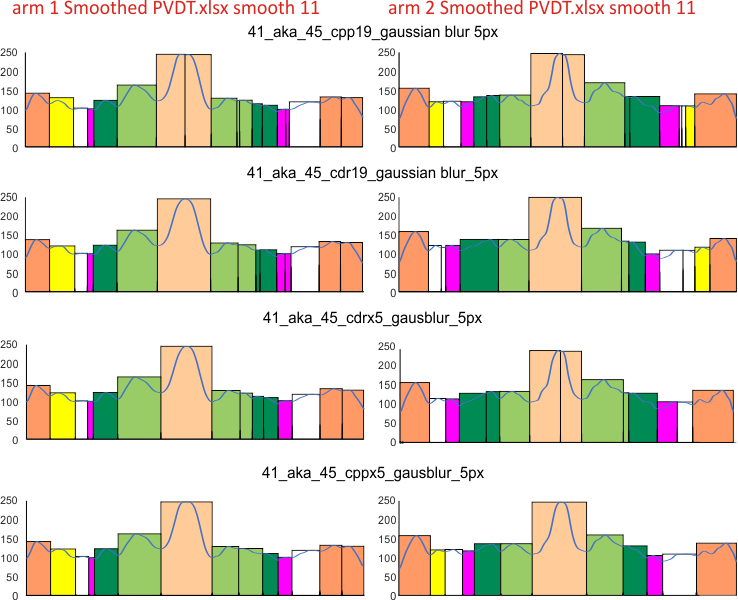
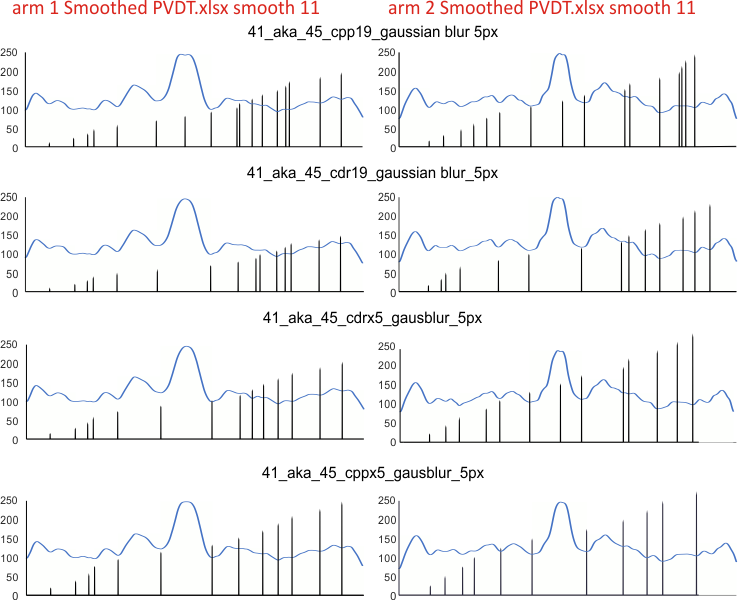
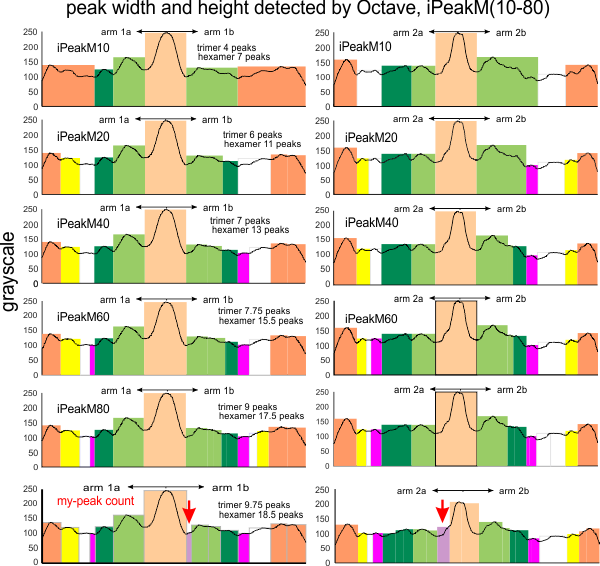
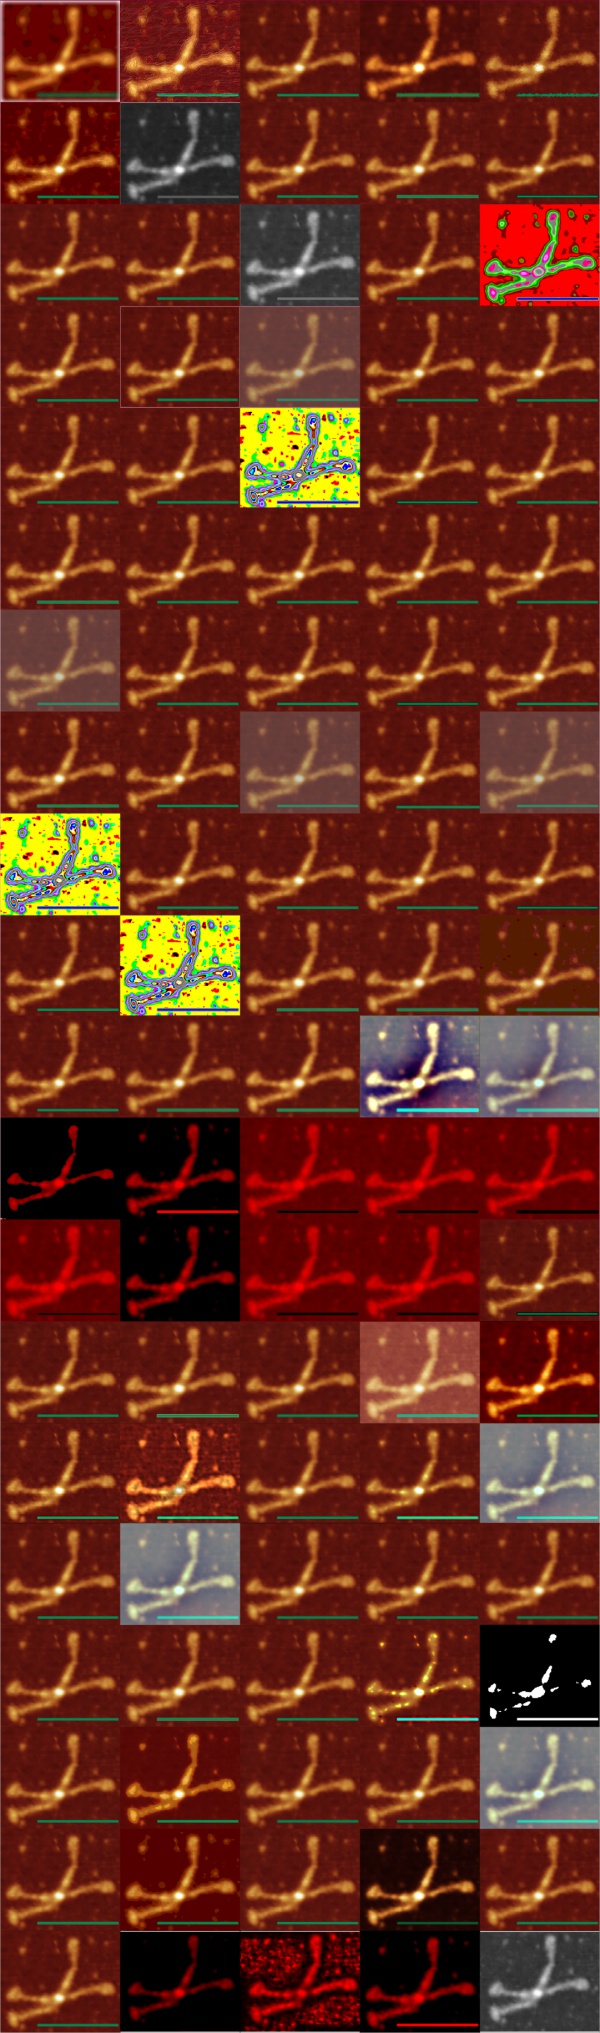
Here just for the record is one of the very nice atomic force images of SP-D produced by Arroyo et al, which I have worked on to determine how many peaks per trimeric arm are present.

Surfactant protein-D street art

While this looks like a ‘brainless’ depiction of a surfactant protein D dodecamer, it really is the result of looking at many many images, counting peaks, estimating peak number from CRD to CRD in a hexamer, and i am pretty sure its quite realistic from the perspective of what is shown using AFM.  I challenge anyone to work out (from actual images) a better diagram.  15 peaks per hexamer, 8 peaks per trimer.  Please let me know when you have succeeded.  Reminds me of a comment i made to someone at UC, working on this protein when he created the most rediculous diagram of a dodecamer of SP-D, he bragged that it was “artistic license”. no such license exists when depicting science.  THIS IS NOT artistic license, it is the culmination of a lot of work, but rendered with “street art” flavor.

ChatGPT and CoPilot are apparently monetized for time, and image processing

It is so annoying to have some converstion going and have the bot say,  “wait an hour”  ha ha..  or “come back in 24 hours”.  I have no personal interest in asking these bots anything except in a research context, particularly about peaks and surfactant protein D. I wanted to see whether the AI could be unbiased about whether there were x number of peaks, or more or less, and come up with a number which I have spent 5 years trying to figure out.

Both kept coming back with detailed instructions for me on how i sould use image filters, and which programs, and signal processing, and which apps…. so nothing really new there.

The answer so far is, uploading hires images is out of the question for either bot, asking it to draw or indicate on the image where the peaks are, is also out of the question, asking CoPilot to please count peaks in an .csv file (anything more than just a few rows and a couple columns is out of the question.  I did get an interesting formula for excel for taking the mean of ten rows — along a column of more than 2000 rows and it came back with a pretty good simulation of the original plot.

So adding AI to plot counts is just not going to happen in the next little while, since image resources on both bots are limited (i dont think i have been targeted…LOL).. and both just keeps coming up with solutions for finding “brightness peaks” along plots, and analyzing those plots that have been suggested by colleagues, friends and my two programmer kids.  So it really has not been much of a help.

In addition, it is really annoying when it quotes data from “my own work” LOL,  I guess I could have put into the chat…. do not include any data from >>>>>> me>>>  .  All in all,  i dont think it helped much.

ChatGPT and SP-D

I havnt had so much fun in days, nor been so frustrated (LOL). I thought maybe I could use chatGPT or CoPilot to verify the number of peaks along a hexamer of SP-D, but there were a lot of barriers. In the process of asking the former to tell me how many bright spots were encountered in a tracing of an SP-D hexamer (a process which the first few encounters proved really interesting, i got this lovely image, and then silence and block.  It was “sweet” to provide me with code for python, but that is not what I had hoped to get.  But i felt this image was so beautiful, though so NOT what i asked for, that i would post it as a great mistake in my communicating what i wanted to a bot in sufficient detail.

It is so pretty that i thought i might turn it into some kind of cross stitch pattern, or perhaps a stained glass pattern.  Certainly this is a great printable image for christmas tree ornaments or window clings.  Who would have guessed.

I went to RCSB to look again at the molecular model of the neck and carbohydrate recognition domains of SP-D, it is possible that data from there were translated into my gwyddion filtered (dodecamer, gaussian blur 10px, limit-range 100-255) image.

The actual image used is shown below this “whatever it is”

Peak finding comparison, PVDT.xlsx vs my peak sorting

I find it interesting how peak finding apps and programs (in this case an xlsx function) differ from what I count. There are variations in what the apps find and in what i count as well. This is all just a dive into what is the “best way” to count grayscale (brightness) peaks along a plot from an AFM micrograph. At this point, it is still up to the researcher to make determinations. I dont see a single app that does what “i think” is right, and I dont do what “i think” is right all the time either.

It might appear that the more measures the better the outcome, kind of like “crowd sourcing”. When querried, “Exploratory data analysis is a technique data scientists use to identify patterns and trends in a data set. They can also use it to determine relationships among samples in a population, validate assumptions, test hypotheses and find missing data points.” So there you have it, just exploratory.
Case in point, variations below in my counts, mostly identical, yet slightly different plots from image in different programs produce different results in the PVDT.xlsx program, just small, and then there are my erros in judgement too. More assessments may mean a more accurate outcome.

Graphs for peaks found below:  ONE surfactant protein D dodecamer, as TWO hexamer arms (15 peaks per hexamer)(found as the mean from 1000 plots) divided in the middle, mirrorred, into FOUR trimers with the center peak as the tallest widest peak. Top image has the PVDT program for detection of peak divisions, and the colors in those divisions are my choices as to the identity of the 15 peaks.

The name of the program which applied the 5 pixel gaussian blur is given: cpp19=corel photopaint 19; cdr19=coreldraw 19; cppx5=coreldraw x5; cdrx5=coreldraw x5. Differences are slight, and one must keep in mind that there is a separate trace through each hexamer for each arm and for each program. This is more likely the cause of differences, than differences in the way each program executes its gaussian blur.  Each was traced with a 1 pixel line using ImageJ. Each was exported with the same y axis to .csv, then opened and plotted in excel. Diagrams were made using CorelDRAWx5.

I did a similar assessment of the same SP-D dodecamer using the Octave function iPeak. Find those data here.

I need to redo two of the plots for the second hexamer (arm 2) …  I did redo a couple of them once to see why the last peak on arm 2 wasnt detected. I know it was bothersome.

Center peak(s) peach color=N term joined peak, composed of all four N term domains; light green peak(s), glycosylation peak(s); orange peak(s) at the ends of both hexamers, CRD that account for the known 5 peaks per hexamer. All other peaks routinely found bring the more realistic peak count to 15 per hexamer. These are color coded, but consistenly not found in the literature as “real” entities though clearly they are.

What is “Undesirable” is up to me to decide (referring to digital signal processing)

This is an interesting term to apply to digital signal processing. What (to me at least) suggests is that these different statistical approaches do little to change the data, but they impose personal “hopeful” results.  This is a direct quote from a very nice opinion paper on digital signal processing, but it just made me understand that the human brain, at this point, is still largely responsible for outcomes of those processing procedures.

Statistics and probability are used in Digital Signal Processing to characterize signals and the processes that generate them. For example, a primary use of DSP is to reduce interference, noise, and other undesirable components in acquired data. These may be an inherent part of the signal being measured,…

I am not saying that digital signal processing is not useful for helping to shape views about what signals (in this case, which peaks) are worth “recognizing as important” and those which are seen as “undesirable“, but the bottom line is still “it is ultimately my choice” and my application of the metrics used in that digital processing that ultimately “I accept”.

So I am not sure why so much credibility is given to these methods over the (yes laborious) task of “thinking” rather than just accepting what the apps put out.
This concept has been brewing for a long time, “the good the bad and the learned” which title i should change to “the good, the bad, and the undesirable” perhaps (LOL), and I have been trying to sort out how much “bias” i add to these apps as i work to find the number of peaks along a trimer (as height, width and valley data).

It seems that the question of the benefit of trying to be diligent at using algorithms for peak determination along a trimer of surfactant protein-D (at least at this point in time) is perhaps not that helpful (save a fairly robust verification that I see just a little more than what the peak finding apps see). I dont think this is heubris, I really think that at this point in time, the nuances of bilateral symmetry and huge differences in peak widths, heights, and peak positions along a plot are pretty much neglected (undesirable and overlooked) in the peak finding apps used so far  (scipy, octave -iPeak.m, AutoFindPeaksPlot.m, Lag-Threshold-Interference, PeakValleyDetectionTemplate.xlsx, PeakDetectionTemplate.xlsx, and others, using various settings (all these apps have been mentioned hundreds of times in this blog).

I am using those digital processing data, along with what i see as peak patterns as a blend for a final choice for peak parameters (yes that’s bias)(bias is a dirty word for ‘learned’).

A quote from the same article mentioned above “…… the final judge of quality is often a subjective human evaluation, rather than an objective criteria. These special characteristics have made image processing a distinct subgroup within DSP” (aside,  i think he should have used the singlar of criteria (criterion) here).

Peak finding comparison, iPeakM10-80, vs my peak finding

I have been trying to find a app for finding peaks that does not depend upon previous peak height and width to influence the peaks following, and the peaks prior to extremely large peaks. I have also tried to find such a app that “understands” symmetry.

What I would like is one that has 0 “influence” and 0 “width” parameters. I find peaks consistently that are very small, and always in a similar place (which for two or more years I have named the “tiny” peak, that lies in the valley between the N term peak and the glycosylation peak(s) of surfactant protein D. I have rarely found that the peak finding apps (this includes scipy, octave, excel templates, stackoverflow) find those peaks with any regularity, in spite of the fact that they very often find “peaks” that I would never assume would be a peak.

I have used the same .csv file of two plots (each a hexamer, thus two trimers) of a dodecamer of surfactant protein D and applied several iterations of Octave iPeakM. The counts below are for peaks per trimer (the N term is included in each trimer though it is a central peak in this molecule, and is included in the count only once in each hexamer). (as an aside, it is interesting that this central N term peak often has divisions, as is seen in one plot, but not the other).

Peak widths for all the Octave plots are determine without my influence. The most botton plot, is MY ORIGINAL PLOT, from before I ever started using Octave or any other peak finding app. Thus something between iPeakM60-80 was/is the best (but not perfect) match for my own findings.  Coloration of the peaks is done for the sake of observing obvious symmetry, the N term peak (peach) the glycosylation peaks (light green) and the CRD peaks (orange) are known (and reported peaks). Four additional peaks are consistently found per trimer. Five additional peaks (total of 8, counting the N term in a trimer) in each trimer is the typical number of peaks found. (that data obtained from almost 1000 plots of trimers previously).

SP-D poster images

The image below is the result of a test of whether the image filters available in various free and paid programs made much of a difference in the detection of brightness peaks (incidence, height, valley, width). The answer, it seemed to me, was that a rational application of many filters did very little to change the raw image, and even after radical filtering, such  as “posterizing” (red and yellow images below)  conveyed the same SP-D structure.

Programs used to score image filtering ranged from  “paid” Photoshop 2021, CorelDRAW 19 (also with the built-in raster editing program of the latter), older purchased Photoshop (6) and CorelDRAW (x5)(also with a raster editing program), and “free” programs with image filters such as ImageJ, Gwyddion, Inkscape, GIMP, and Paint, as well as several image filtering options in “free” Octave.  Below are samples of all of the above for checked uniformity in their individual application of filtering algorithms, using a single dodecamer as a test photo.

That photo was derived from a screen print from Arroyo, et al. Easily identified are the N term junction of the four trimers (bright center*), just lateral to that the glycosylation site (each of the four trimers shows some degree of brightness*, there are at lest three bright peaks found lateral to the glycosylation peak (as of now, not named and with no known function but highly repeatable peaks are found in literally hundreds of plots of dodecamers and separately as trimers), and on the ends of the trimers, the carbohydrate recognition domains*..  which typically have several peaks combined (which is consistent with that domain being modeled on RCSB as three flexible and floppy  globular formations. Just before the CRD domain peaks,  is the neck domain, which may or not be visible as a “peak” depending upon how the molecule is arranged during processing. (nb, the * denotes known peaks).

One image filter (Gwyddion, image presentation filter) (center image bottom row) probably does the best job of maximizing the appearance of bright spots (peaks).

The three posterized yellow images were used to test (using the same settings) whether various programs would produce identical results, which actually did appear to be true. The reasoning behind this test was that the old Adobe Photoshop 6, well outdated, but free and easy to use, was compared with the same filters in the paid version of Photoshop 2021. Similarly, CorelDRAW x5, also old, was no different in application of imaging filters with the same settings as CorelDRAW 19.  This opens opportunity for reliable image filtering to be had from existing, familiar and free programs with easy to use formats.

Image Filters and programs (out of the sample of 100 in the image below) that will continue to be used for peak finding are:

1: no processing (as a control)
2: Gaussian blur (2px, 5px (10px in one extremely pixelated image)(CorelDRAW, Photoshop)
3: Limit range 100-255 (Gwyddion)
4: Gaussian blur plus 250 highpass (Photoshop)
5: Gaussian blur plus 50-50-50 unsharp mask (Photoshop)
6: Median filter 10px (Photoshop)

This turns out to be 6 imaging filters, and 6 signal processing functions to be applied to peak finding.