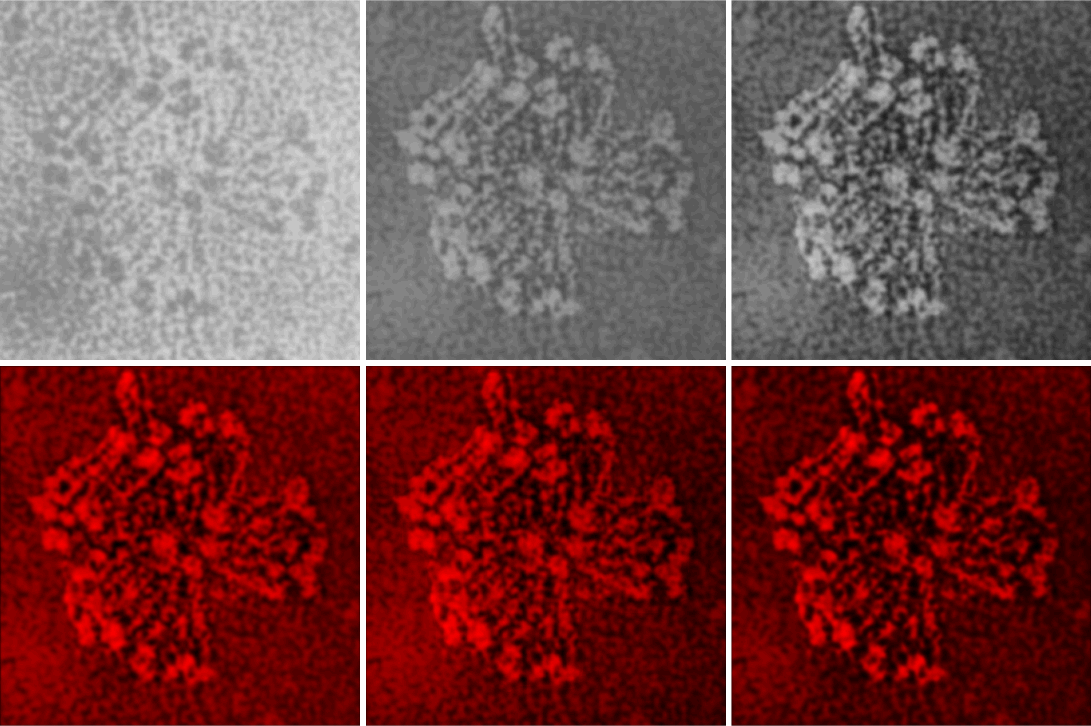
Bovine conglutinin: Did image processing improve information in this image of a multimer (Andersen et al)? In one sense i think it did increase the ease with which one can find the N termini (which in this case seem to be side by side) and also it increases the ability to see what seems like an acute folding of all four arms of the bovine conglutinin in to an arrow shape, with the point being the N termini junction. This was both an exercise in using Gwyddion to perform data processing (the 2D continuous wavelet transform (7 px gaussian).
Top left image (original image Figure 8b, Andersen et al, 1992) tantalum shadowing. Top middle, photoshop layered background contrast reduced, top right, image inverted and flattened and contrast enhanced. Bottom left, image imported into Gwyddion, bottom middle 2D continuous wavelet transform, bottom right, saved and highlights, shadows and midtones adjusted in CorelDRAWx5.
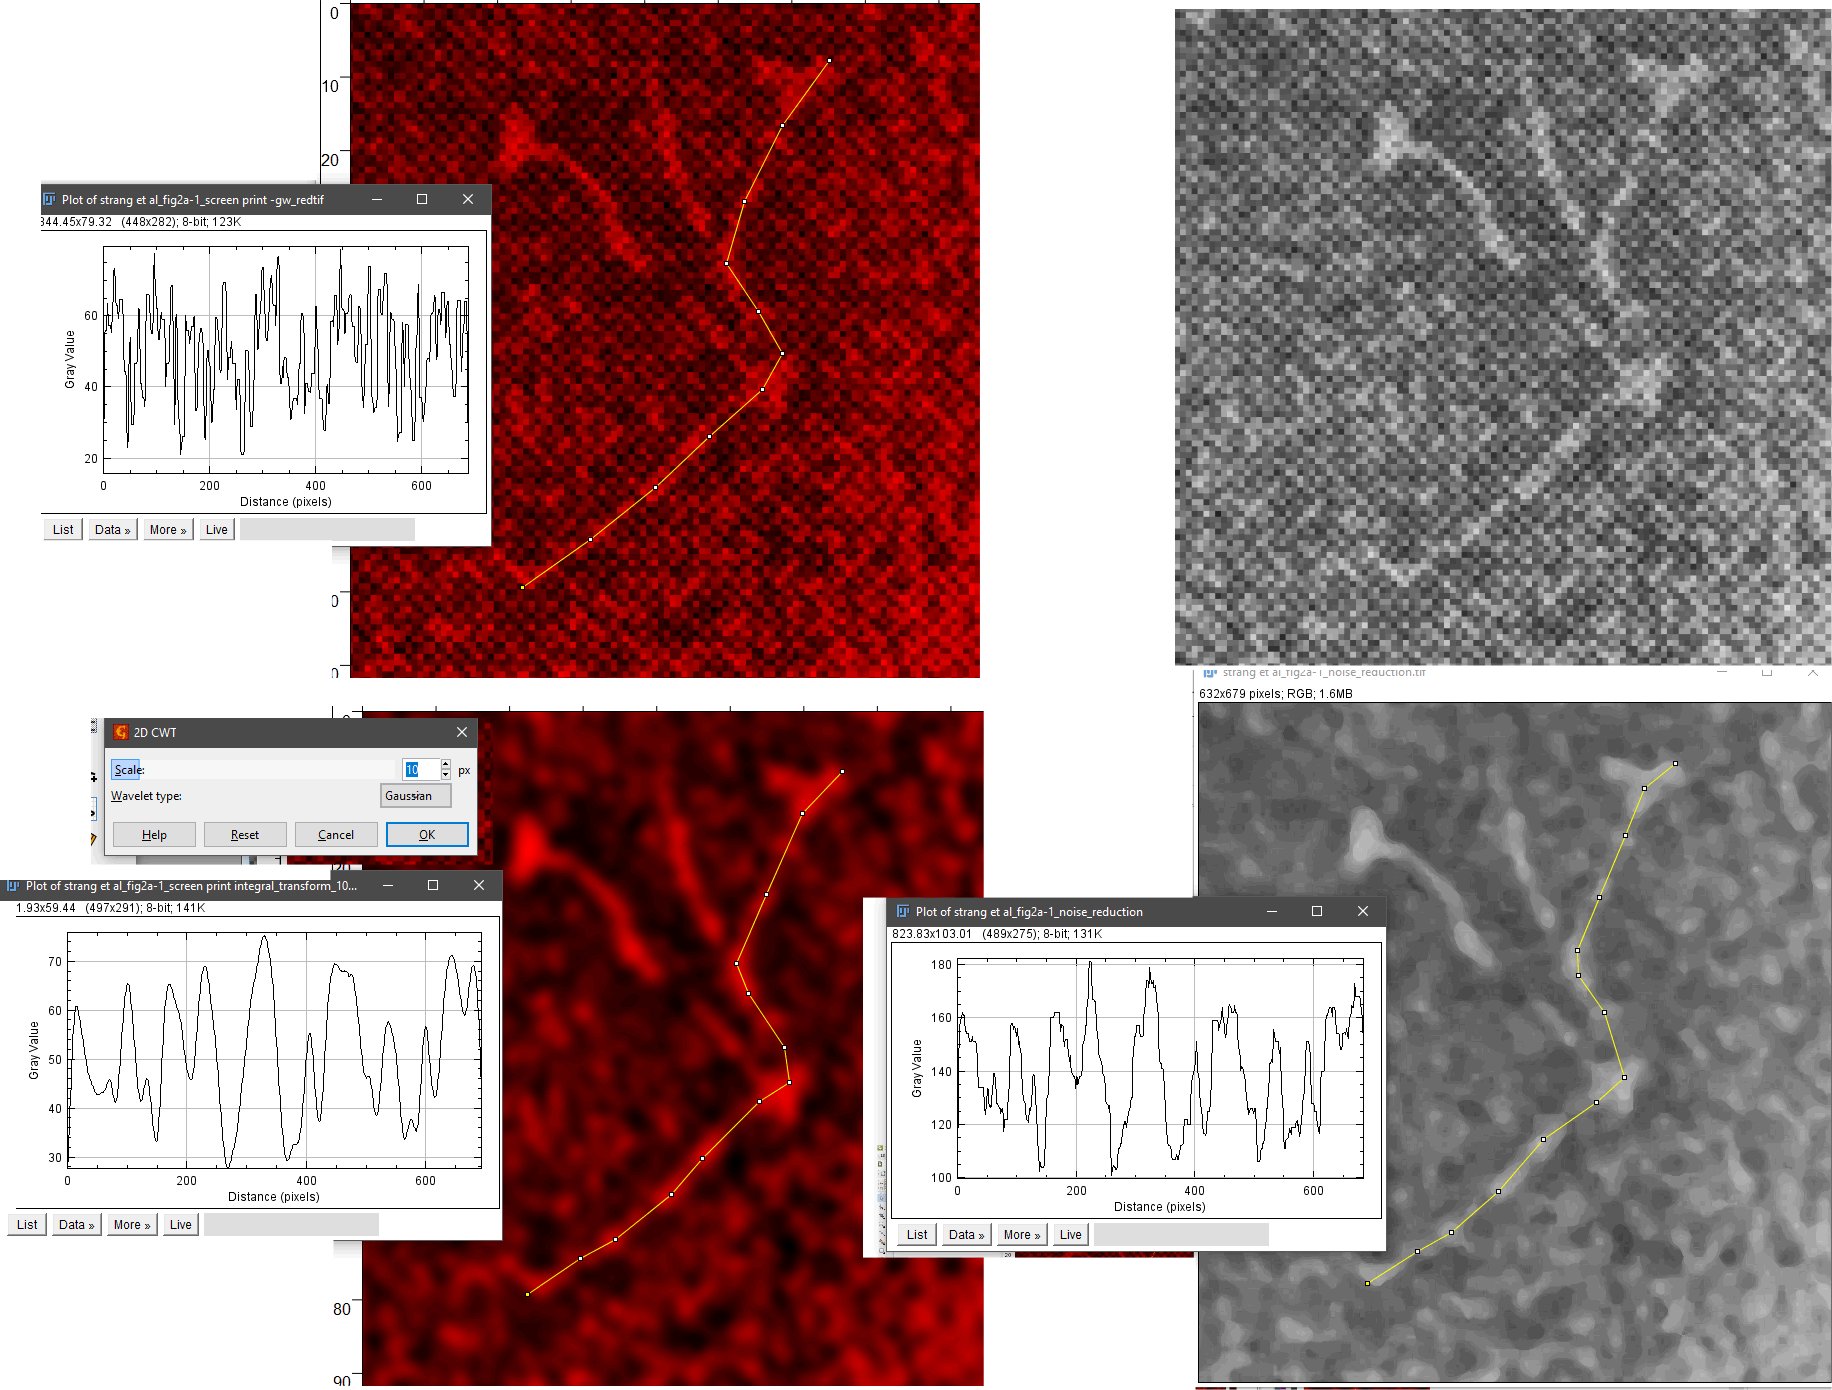
It is amusing to see peaks along the arms of the bovine conglutinin collagen-like-domain… three or four little luminance peaks, reminds me of SP-D. Upon measuring them in imageJ, it would be difficult to distinguish these peaks from background. I will figure out a way.
The N termini junction has the distinct look of dodecamers bent at an acute angle and nestled together side by side (nb the bottom group of four N termini junctions and approximately 16 independent arms radiating.
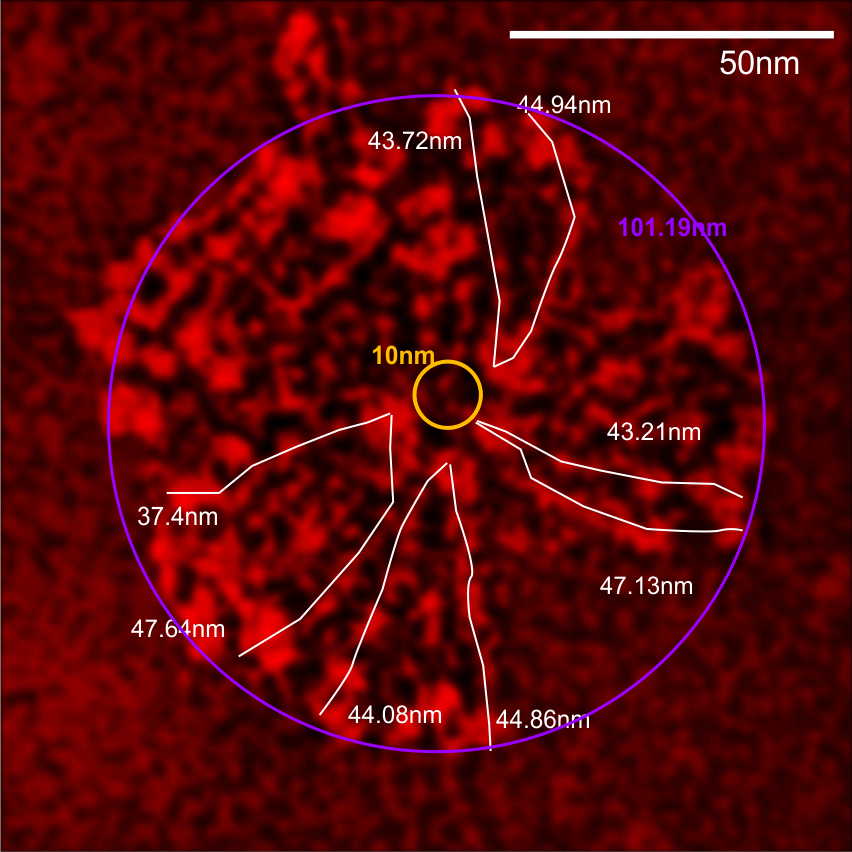
Andersen et al report that the arm length (in their figure 10 and legend show an arm length (without the CRD as 40nm, and the CRD as contributing 4.5 to the length and add to that another 3.25 nm (half the N termini group) comes out to 47.75nm, which is like their 48nm reported as half he 96nm CRD to CRD total that they report.

Individual arms were measured with a segmented line but in this sample the length of the arms did not differ from what they measured as the “whole multimer” (see below). That said, my diameter measures 101.19 touching many of the outer borders of the CRD, so there is a 4nm gain thee somewhere. A measure of a circle that is not best way to measure this shows a 10nm gap (which might be less or more depending upon the multimer). I wish I could say that there is a ring concentric to the N termini lumps that looks like an elevation for a glycosylation site – but i dont see anything that resembles it here.

