
Monthly Archives: March 2023
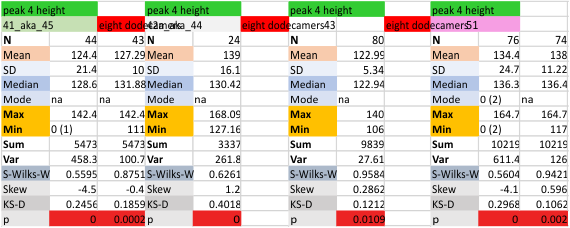
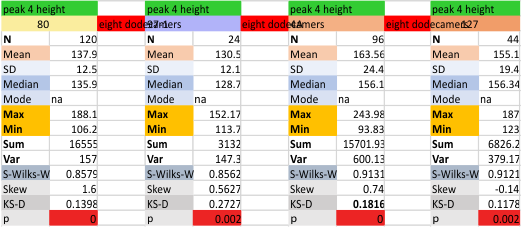
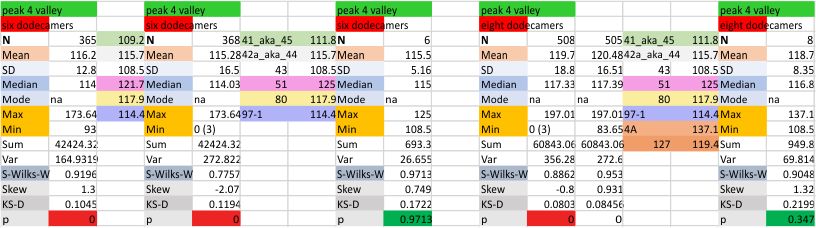
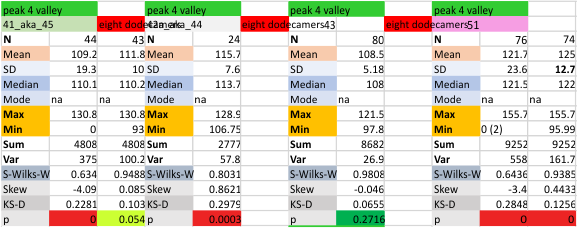
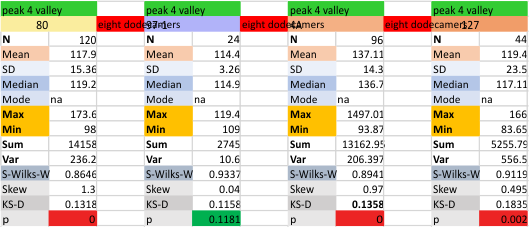
Eight dodecamers: SP-D – peak 4 height and valley
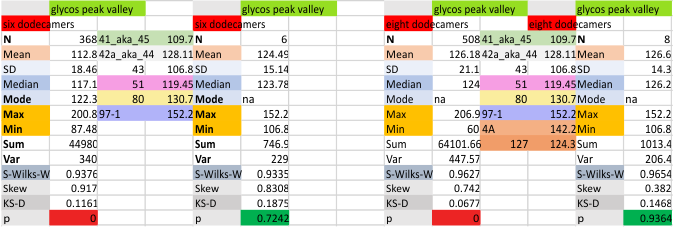
Eight dodecamers: SP-D – glycosylation peak height and valley
Same MO.
peak height
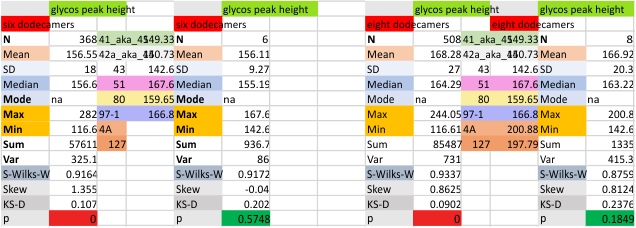
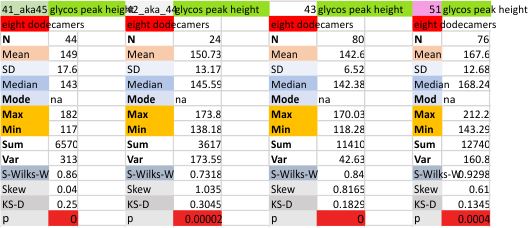
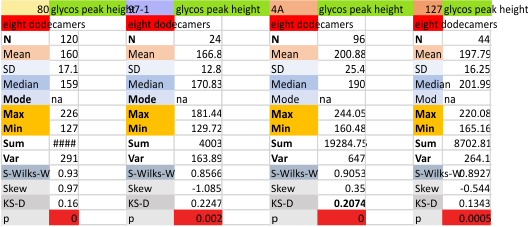
peak valley

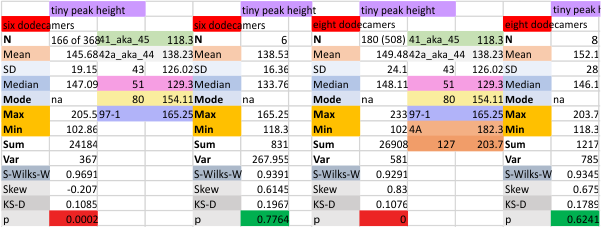
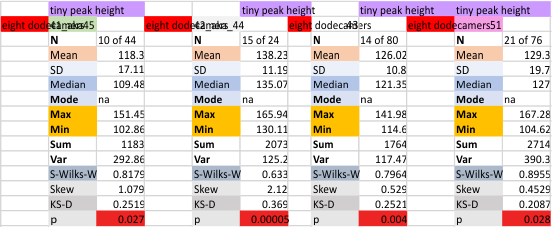
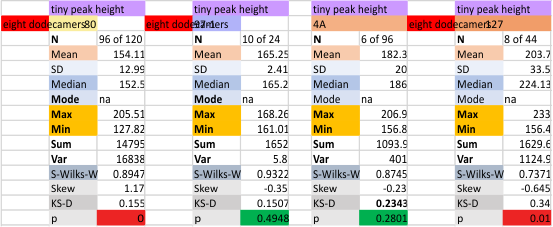
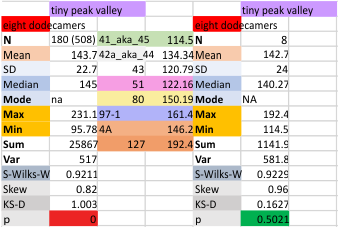
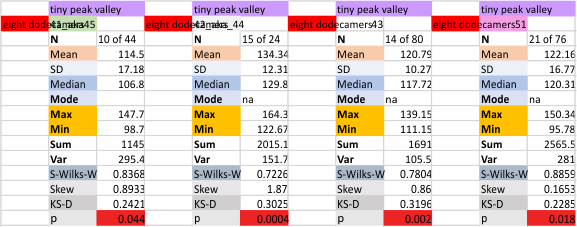
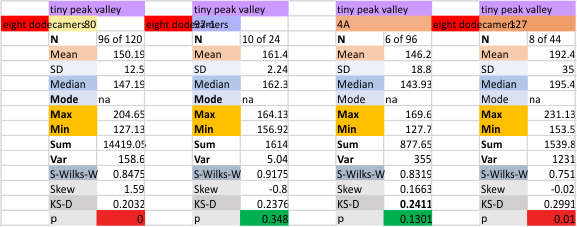
Eight dodecamers: SP-D – tiny peak height and valley
same mo.
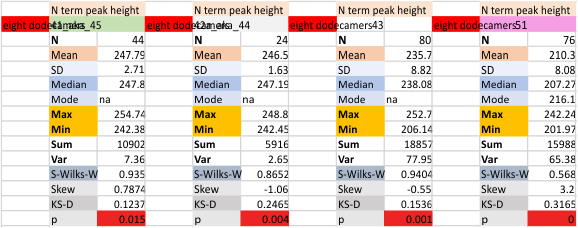
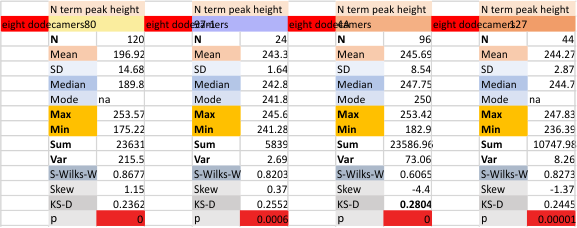
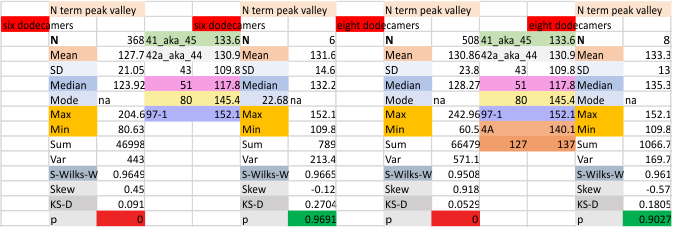
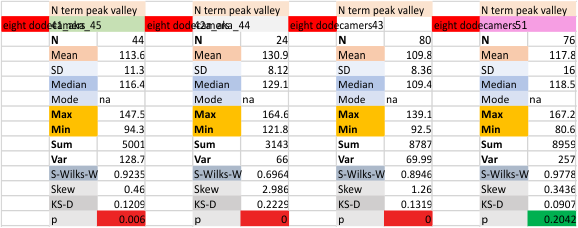
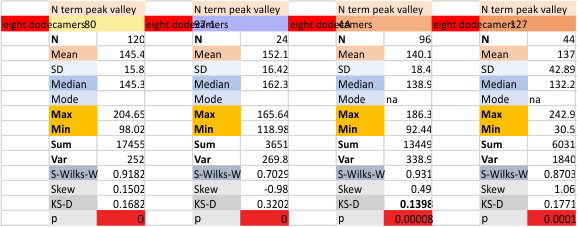
Eight dodecamers: SP-D – N termini junction peak height and valley
Peak height (grayscale values) for all plots of trimers from 8 dodecamers of SP-D. Mean peak height for the N term peak is something around 233nm +/18nm.
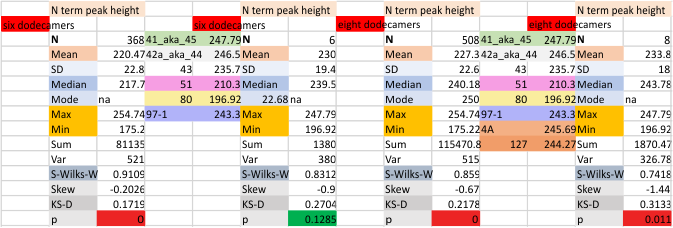
Lower images are peak valley (grayscale 0-255, values plotted in ImageJ)
Eight dodecamers: SP-D – N term ?x subpeak height
There is often a slight decrease in the N term peak, likely where the N term domains join the trimers at the center of the dodecamer. This is an infrequent event and its detection is also related to how one draws the plot line through the center of the image of the molecule. When the N term peak width is listed there are occasions when it interferes (reduces) the total N term peak width. The tiny change in grayscale (height and valley) of the N term peak is pretty small. I have put a ? in the title of this peak to denote its inconsistent appearance.
It is nevertheless listed here in a graphic and below, it appears in two of the eight trimers in these data.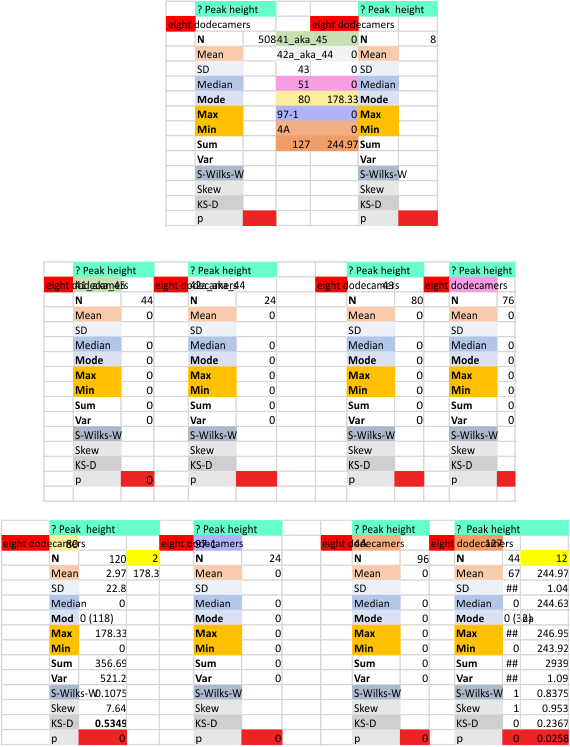
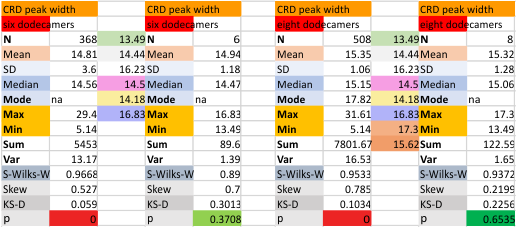
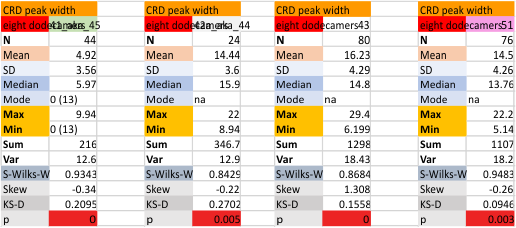
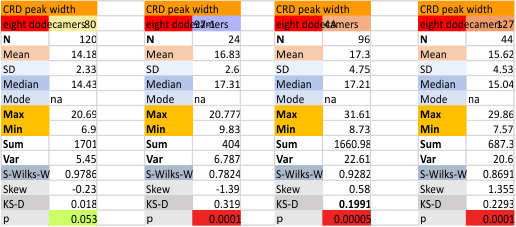
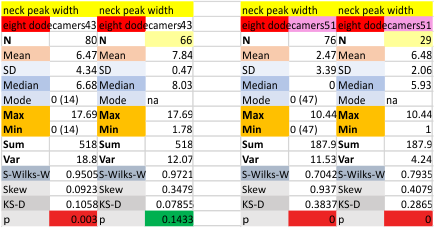
Eight dodecamers: SP-D – carbohydrate recognition domain peak width
Same MO, but since this peak appears 100% of the time (so far) there is no second column where the mean (and other parameters) is calculated excluding the missing (undetected) peak values. Difference in CRD peak width is certainly not very different from the first 6 dodecamer summary than the first 8 dodecamer summary. Some benefit is gained by using the means of each, rather than the individual trimer values.
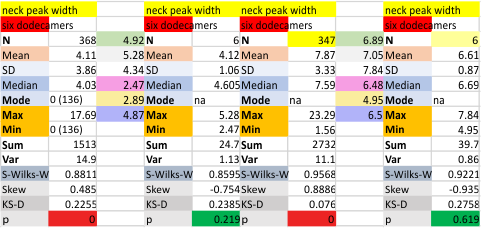
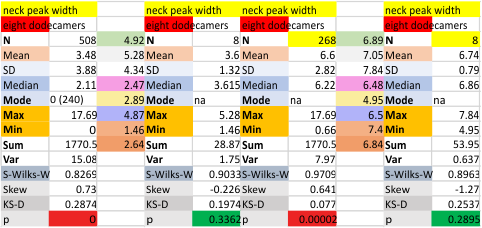
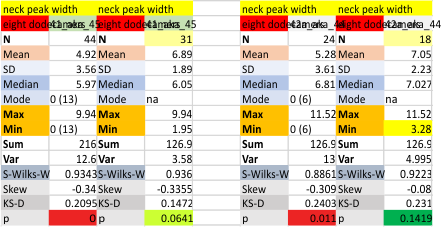
Eight dodecamers: SP-D – coiled coil neck domain peak width
Same MO.
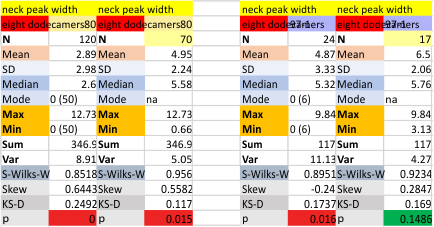
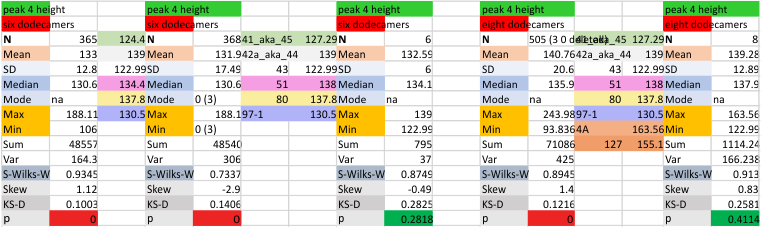
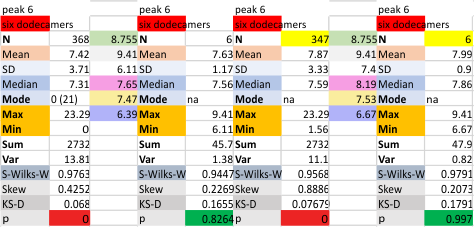
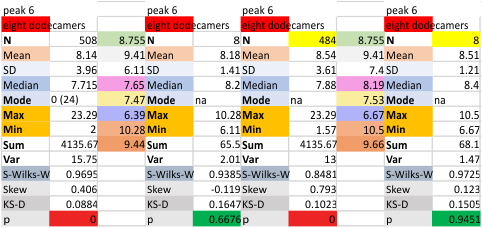
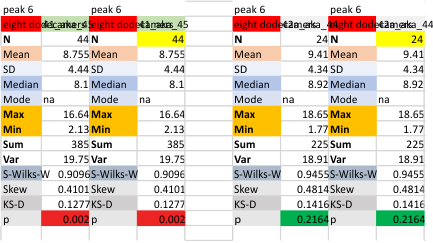
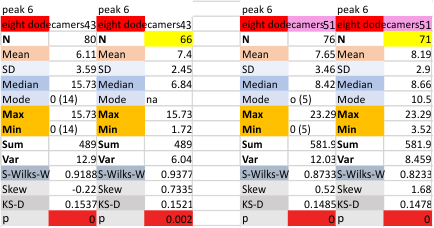
Eight dodecamers: SP-D – peak 6 width
Same MO as previously . In my own observations I have seen this broad low peak as a consistent feature, perhaps more consistent than peak 5.
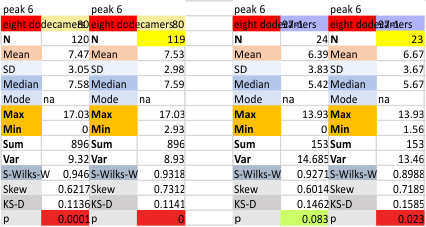
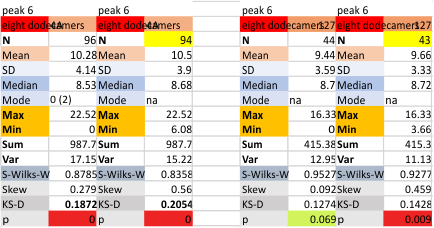
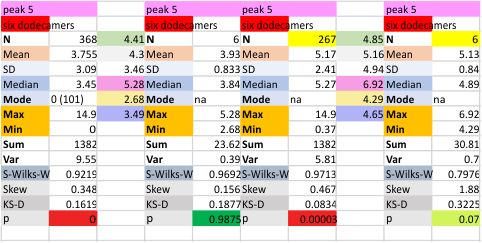
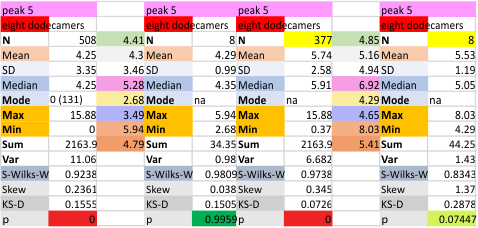
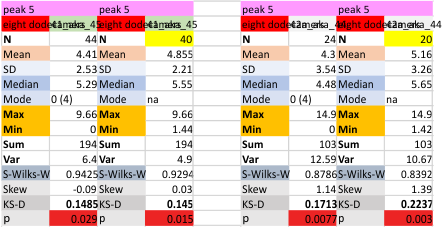
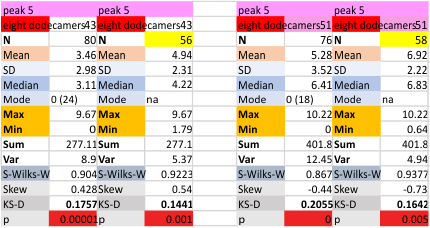
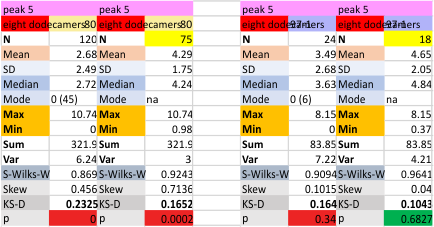
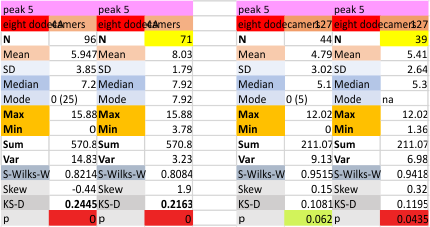
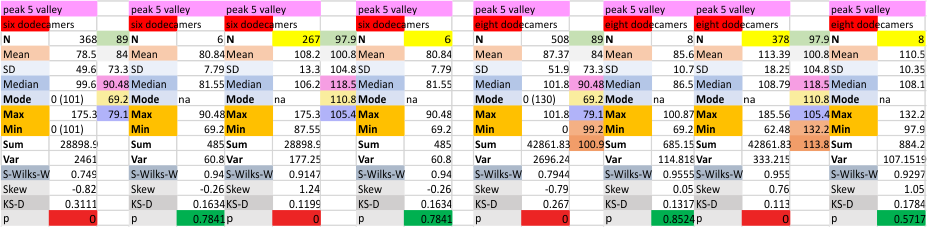
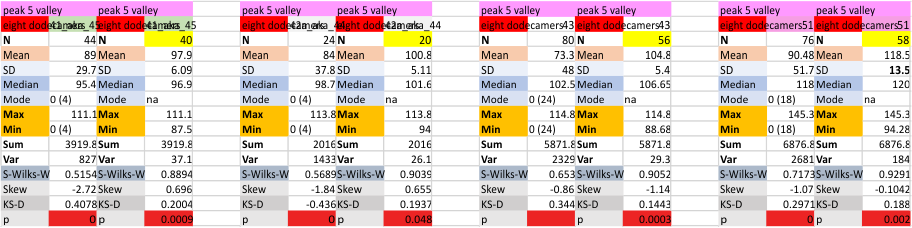
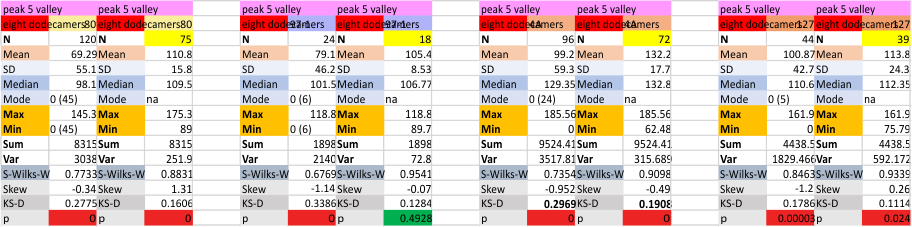
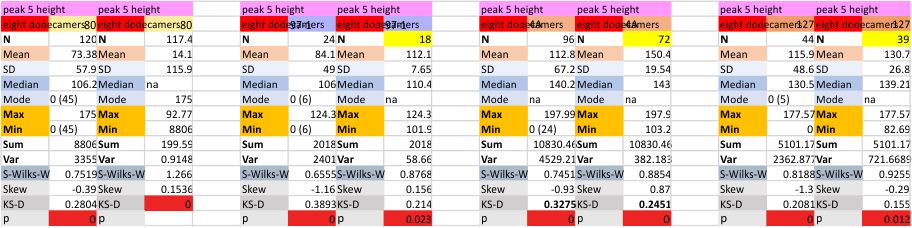
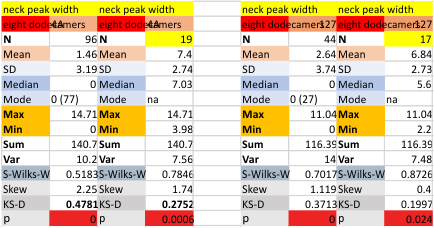
Eight dodecamers: SP-D – peak 5 width
These data were derived using the not-detected peak values (listed as 0s) included in the whole sum, and also with the not-detected peak values. Those data without the missing values are indicated with a “yellow” color in the cell.
I am actually glad that the data dont change much regardless of whether it includes the 6 dodecamers, or the 8 dodecamers, or the missing values, clearly the data are pretty stable.
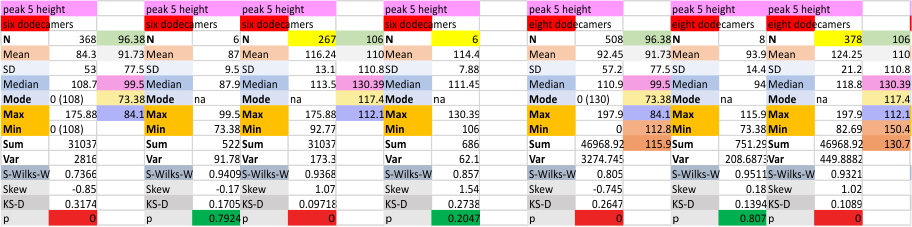
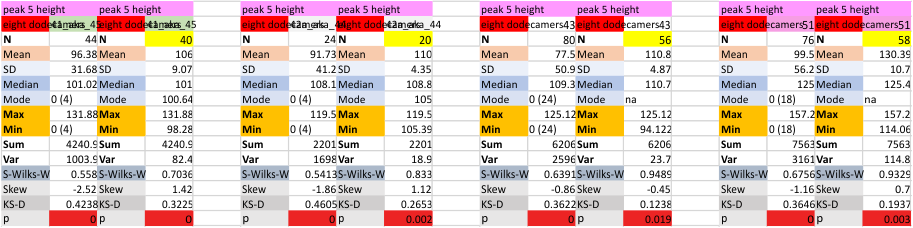
Images below (top two image are the summary of all the trimers counted (six, and eight trimers). Peak 5, (color has been pink in every post for the last two years) is a thin and low peak which is present in Values include each trimer plot as well as the dodecamers as single entities (n=6 and n=8). 72.5 (six dodecamers) and 74.4 % (eight dodecamers) of the time, peak 5 is detectable. A nice round number for the width of peak 5 is 5nm.
Each dodecamer is treated separately and data are listed below the summary tables.