I am pretty sure this is just because exports from gwyddion are the R of RGB images, any help coming from the community that uses Gwyddion is welcome. It causes some problems when using ImageJ plots of the gwyddion exported images and images exported from other image processing programs (as in every other program i have tried (about a dozen).
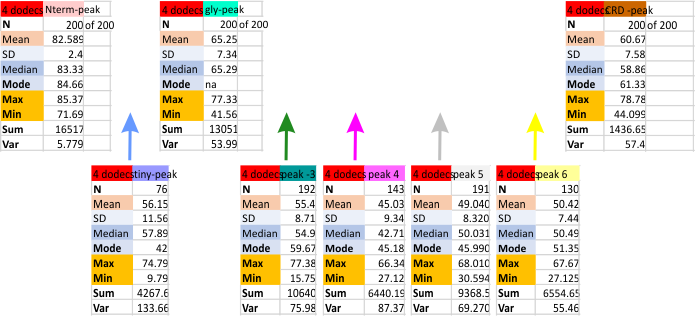
I found the peak heights using just the images processed with gwyddion, in particular the limitrange filter as a separate data set. Results are below. It is clear that the three peaks which have been published (N, Gly, CRD) per trimer are present 100% of the time (in this case, all 200 of the 200 trimer plots. There are two other peaks (peaks 3 and 5 which occur because of their characteristic shapes…. they were easy to recognize. That is peak 3 which was at least a broad as the glycosylation peak, but usually lower peak height, and the broad flattened peak (peak 5) also low on the grayscale. These were present about 95% of the time. The peak that sometimes shows up (most likely the coiled coil neck peak is peak 6 and depending upon the position of the CRD, it shows up, or doesnt show up (likely covered by the ability of the CRD domains to land in different positions during processing. CRD does appear as one, two or three separate bright areas at the C-term end of each trimer. This also makes it a “choice” where to draw the segmented line that becomes the grayscale plot in ImageJ.
These data are for images processed in Gwyddion, and peak numbers (see previous posts) are determined mostly in several signal processing programs (Octave, PeakValleyDetectionTemplate xslx, a LagThresholdInfluence plotting algorithm, and scipy peak detection algorithm).
Sorting peaks into the peak numbered from N (peak-1), tiny peak (peak-2), glycosylation-peak (peak-3), unknown peaks, 4,5, likely neck region (peak-6) and carbohydrate recognition domain (CRD peak 7) is done manually.
Means and other values prepresent grayscale (0-255). Three highest peaks (top row of values) are those that have been consistently reported in the literature. Potentially additional peaks are the 5 boxes below.