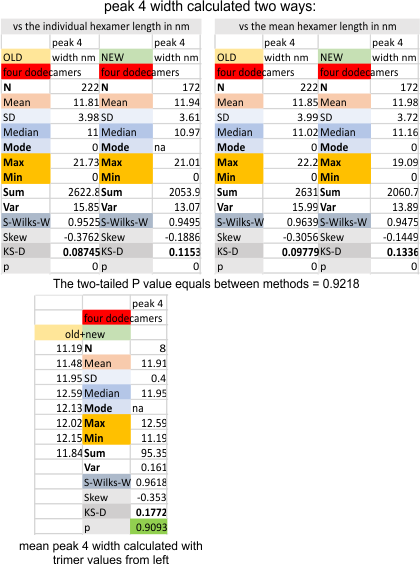
This peak, consistently appears, (98.8% of the time – 5/392) plots in a combined dataset, the old and the new (shown below). The fourth peak (N term peak=peak 1, tiny peak=peak 2, glycosylation peak=peak 3, and this peak lies lateral to the glycosylation peaks. It appears to have a lower peak height, and a little broader peak width. Data below, calculated two ways, the summation of the old and new dataset using four dodecamers, shows that calculating them in these two ways matters very very little (p=.9281). The peak width is about 11.9nm in width.
