Category Archives: Ultimate order, the cell
Orderly thinking:
observe
question
hypothesize
test
analyze
deduce
Word-doodle: Hell
I don’t know why
They are… except that
Stupid things are
Common. They describe
Hell in ways that
Make them laugh.
You like to hear
Me laugh you said.
Knowing
I’m in my hell
Again.
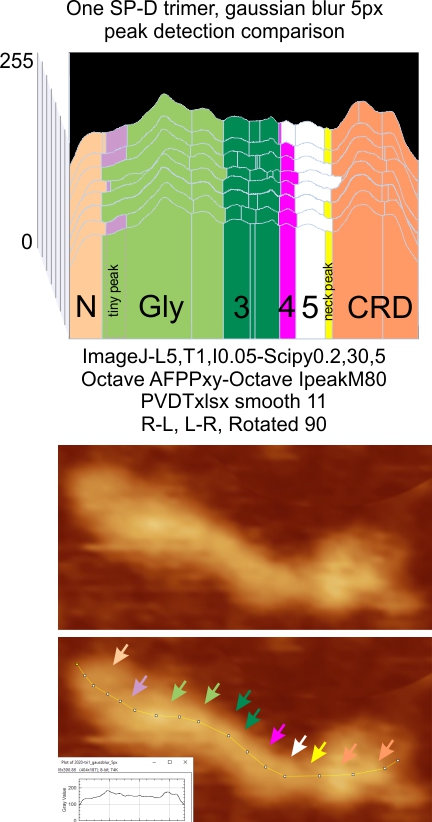
SP-D trimers: peaks measured in a single molecule by many programs, and tracing variations
Tracings through the center width of a single SP-D trimer were assessed for peaks (grayscale – 0-225). The data, gathered using many programs and tracing variations, show just about the same peak pattern as similar measurements of trimer peaks gathered measuring SP-D multimers (hexamers and dodecamers, primarily). The same programs and apps were used for both trimers alone, and trimers within multimers. There were a couple things that I actually had hoped to determined by just measuring trimers.
The image from which the summary data of the single trimer is derived is shown below (one which has been posted before). The new visual presentation is the ridge plot from 8 different plots of the peak number, height and width of that single SP-D trimer. Arrows pointing to the places where peaks are found in the AFM image (Arroyo et al, 2018). In addition, an actual tracing shows how the segmented line travels through the center width of the molecule (screen print from ImageJ). This image was processed with a 5 px gaussian blur before peak finding apps were applied. Data (not shown) was also obtained from the image as it was retrieved from the publication without image filtering.
NOTE: The top plot in the ridge plot has a narrow “pink peak #5” this was my sorting division and in comparison to other apps, I should have have included the part of the peak to the right) in that group. Color divisions are always my interpretation of the plots. Vertical divisions are those determined by peak finding apps.
Only the “tiny peak” and the ” neck peak” are not detected in all the plots all the time (i.e. by the concensus criteria established for each program). Peaks 1, 3, 4, 5, 6 and 8 (left to right) in this group of plots, are detected 100% of the time. The number here is 8, but in hexamers and most dodecamers, the total peak number is 15, this is because the N term peak becomes one with the other trimers in the multimer, which then makes the N term peak the brightest and widest peak in the plots.
The glycosylation peak is often a multiple lumpy peak, as is peak 4, and certainly the CRD peak often shows the separate three parts of that trimer as different bright spots.
1: does the lower height and lesser width of the trimer’s N term peak change the frequency of detection of the small, but (obvious to me) tiny, low, narrow peak on the downslope of the N term peak, and valley between the N term peak and the Glycosylation peak, and I think the answer is “not as much as expected”. In addition, the N term peak is less in width and lower in height when not joined to another N term as occurs in hexamers, dodecamers, and other multimers. N term seems to be the only peak that is very different when analysed without a junction with another N term peak.
2: is the peak number (and sorting) any different when traced from trimers, vs hexamers, and I think the answer is “not really”.
3: is there a consistency in peak detection? among the various image and signal processing functions that guides different divisions among the peaks detected, and I think the answer here is also “not really”.
4: are all the various peak detection programs and functions better than just looking at the peaks plotted in ImageJ, also, “not really”. Concensus is nice, but a conservative estimate using those plots seem to provide a mean peak number that is no different than the apps.
All in all, little new came from using right to left, left to right, vertical mirrorred tracings, bottom to top tracings on image rotated 90o ccw.
Hydrophobic peaks plotted for SP-D AA are similar in position to grayscale peaks of AFM images of SP-D
using structure
Plotting peaks in a hexamer of a “fuzzy ball” multimer of SP-D
Plotting peaks in a hexamer of a “fuzzy ball” multimer of SP-D are problematic at best, and the plots that most coincide with the hexamer plots from dodecamers are “V” shaped tracings making the boundaries of the N term domain peaks hard to define. It is a decision that needs to be made, that is whether to go back to measuring hexamers “within the fuzzy balls” is important to completeing a writeup on SP-D trimer (hexamer) peak number, size, and shape.
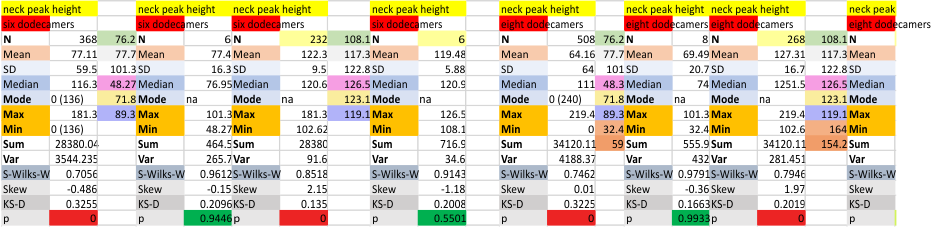
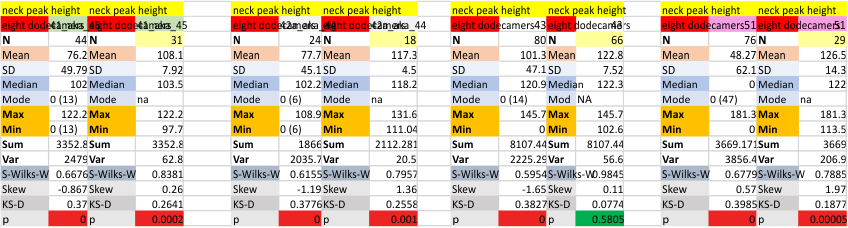
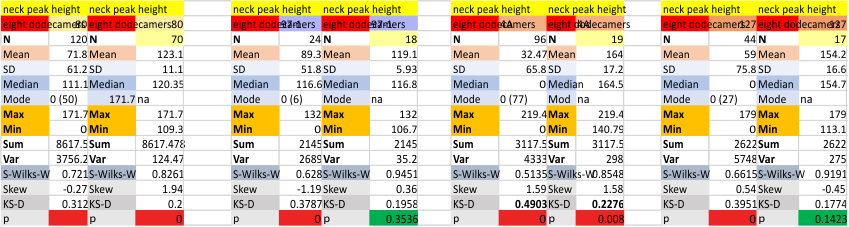
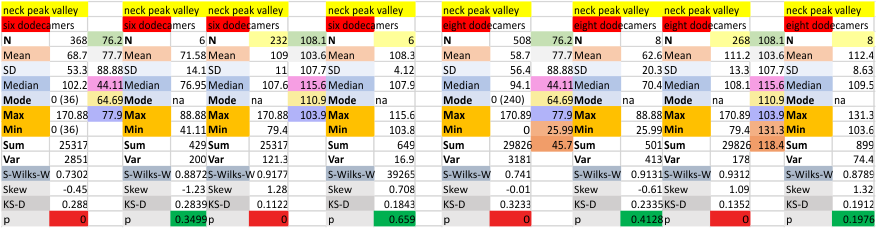
Eight dodecamers: SP-D – neck peak height and valley
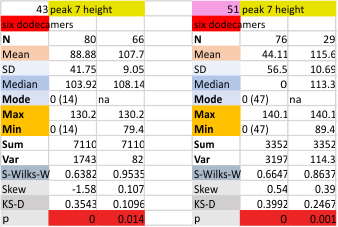
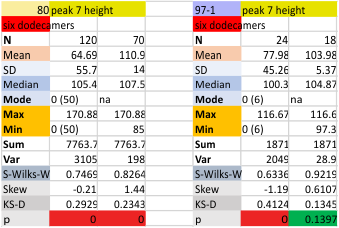
Six dodecamers: SP-D – peak height (peak 7)
Values with and without the “0” missing peaks are given for all peak plots, and for individual dodecamers as well. To me it makes no sense to show the values with undetectable peaks, but it is here (along with the number of times the peaks dont show.

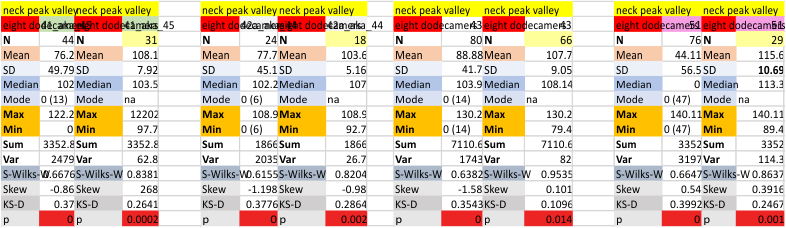
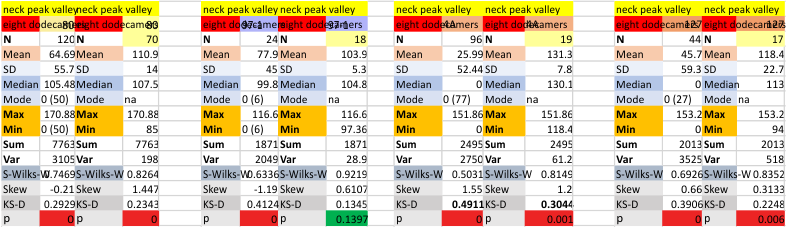
Six dodecamers: SP-D – N termini junction peak width
Six dodecamers: SP-D – N termini junction peak width. The N term peak is a merge of the right and left hand sides of the trimeric mirrors of the peak measurements. The N term peak width was measured on mirror-trimers from the peak height, but these two values were merged to form the width of a complete N term peak width, not just half. Top set of numbers is for all individual measurements (left) and the individual dodecamer values (right) as separate means. Individual values for each of the 6 dodecamers = bottom set of values.
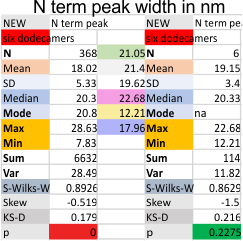
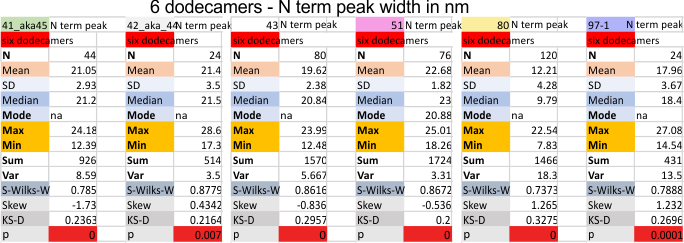 i dont know why molecule named 80 has an N term peak that is so thin… but i checked and it seems to be correct.