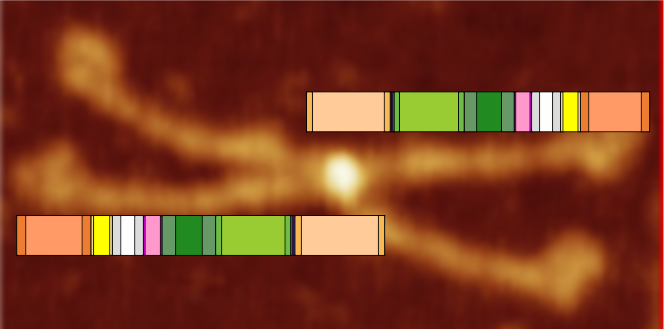
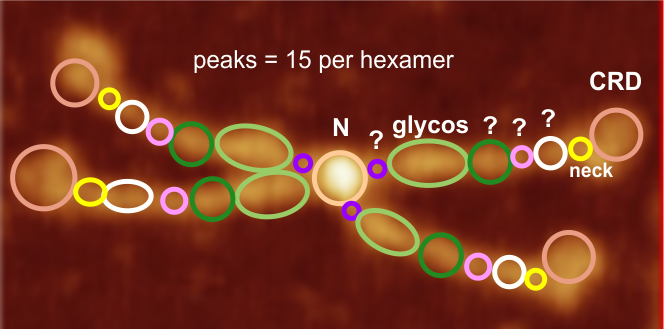
This is going to be a hard sell to someone who has not spent dozens of hours looking at SP-D images. The mean peak width (+/SD) are in relative proportion placed just over a randomly selected image of a SP-D dodecamer. The color bar shows the mean peak widths for the 15 peaks (the number 15 was obtained by signal processing (peak finding programs), image processing (represented here are two or three image filters) and 4 dodecamers, hundreds of grayscale plots and width measurements). There is consensus, but it is not immediately intuitive. Colored bars with SD on either side represent peak width in nm (relative). Count from N term to CRD on top bar, CRD to N term on bottom bar. Glycosylation peak is mid-green color. Each peak is identified on bottom image with text and a circle and color to match the actual peak widths shown on the top image.
 My sorting of those 15 signal processing identified peaks using circles and colors to match image above. Four peaks (per trimer, 8 peaks per hexamer) as yet unidentified are marked with a questionmark.
 peak 1, N=19.9nm+/1.42nm
peak 2, tiny=0.9nm+/0.38nm
peak 3, glycos=16.7nm+/1.32nm
peak 4=11.98nm+/3.7nm
peak 5=4.18nm+/0.41nm
peak 6=6.89nm+/1.94nm
peak 7, neck=4.74nm+/0.56nm
peak 8, CRD=16.56nm+/2.04nm