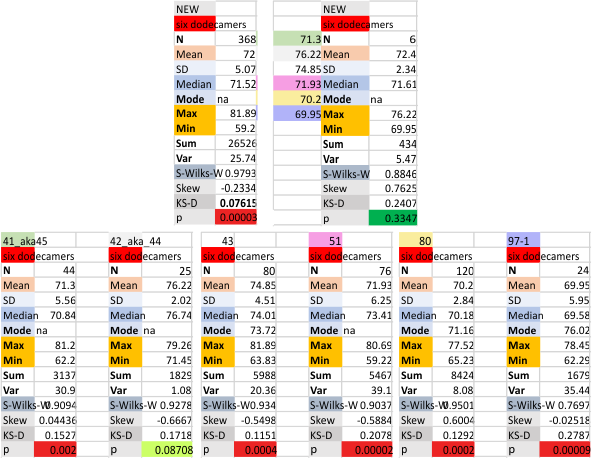
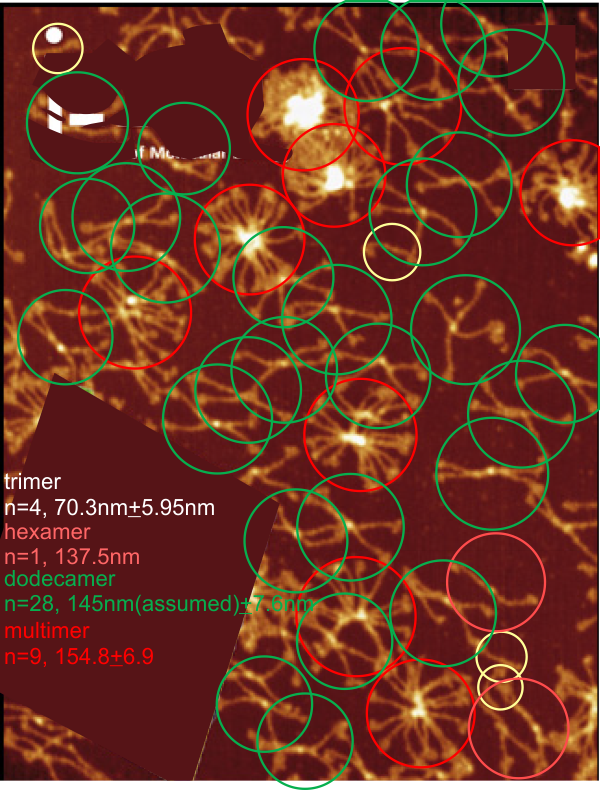
 Six dodecamers: SP-D – an analysis of shape, peaks and size, AFM image, these trimers are not normalized in size (yet) so these values are for each of the four trimers in a dodecamer, and they begin at the (far) furthest side of the N term peak and move laterally to the end of the CRD peak. This means that each N term is measured as a whole, for each of the trimers. In addition, when we get to peak width, the valley point is on the side of each peak which is proximal to the N term, or maybe a better term is medial to the N term, so the peak valleys are found in mirror images of the trimers, medial in the direction of N term to CRD each direction. Here is a link to easy measurements (diameter) of dozens of SP-D molecules (Arroyo et al, cover image) and little has changed in the time between when i began working on finding out how molecule size variation of SP-D hexamers in 2019 (btw, the simplicity of this approach is really striking and the image is pretty nice too), and what is seen now in 2023. It is really hard to rationalize the 3 to 4 hours required to make this image, and the 3 or 4 years it is taking to validate those values in an “unbiased” (tongue in cheek) way. There is no unbiased observation here, just call it science with discretion. Below, top section is the individual value summary (left) and the n of 6 dodecamers (right) each as an N. Bottom row has data for each individual dodecamer.