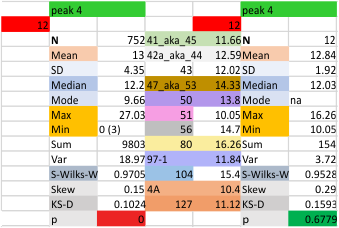
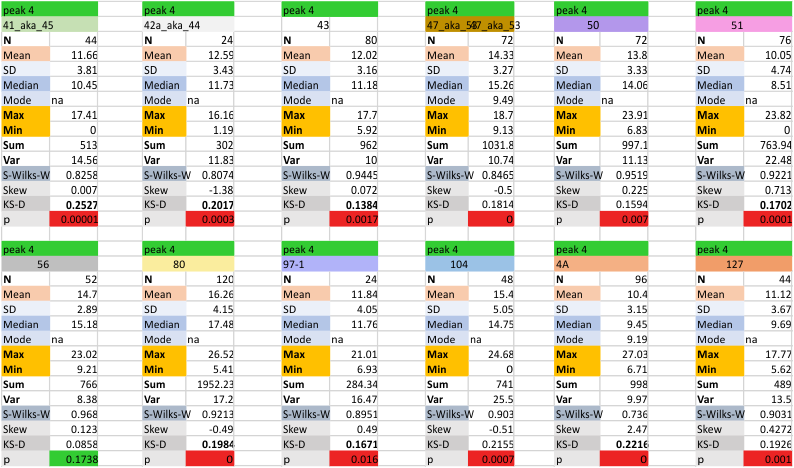
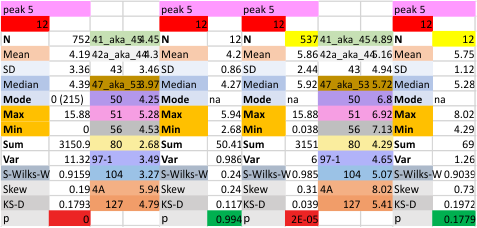
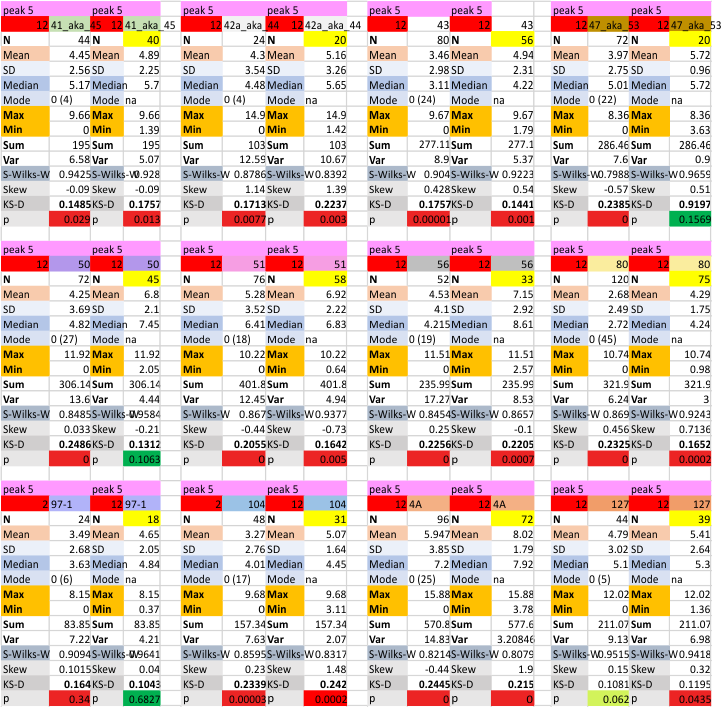
The approach to the statistics is the same as has been used before. The summary has two elements if there are any missing values. if there are none, or as in the case of peak 4, only one or two out of several hundred, then i have just left them in. If the missing values (see two bottom sets of plots that are the values found for peak 5 are several percent of the total (recall… peak counting here begins at the N term and moves left to the CRD and width is reported in nm, as determine for each image by the bar marker provided by the author — which… can vary btw) , then there are four summar columns (one set with missing values calculated in as “0”s, and one set where they are left out). In these data, peak 4 (adjacent and lateral to the glycosylation peak in SP-D) is about 13 nm in width at the valley, while the peak adjacent to peak 4 (peak 5) is less than half that wide at 5.7 nm.