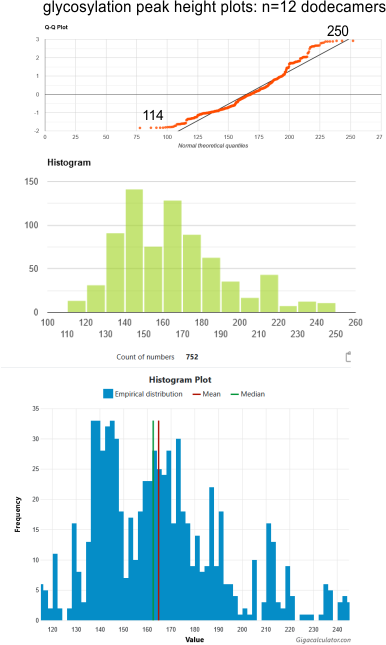
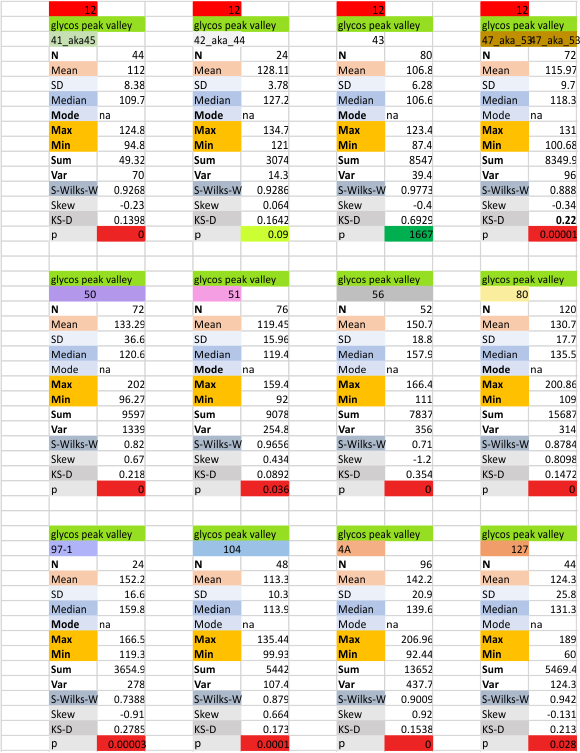
It is easy to see where some images of SP-D dodecamers are not as well defined in terms of peak number as others. Peaks to the left of the mean, meadian, are found here. Kudos to the makers of calculator.net and gigacalculator.com. Being a visual person, their Q-Q plots, histograms and various little round indicators of significance and especially calculator.net, their explanations, oh and the Shapiro-Wilks calculator. I thank you all.