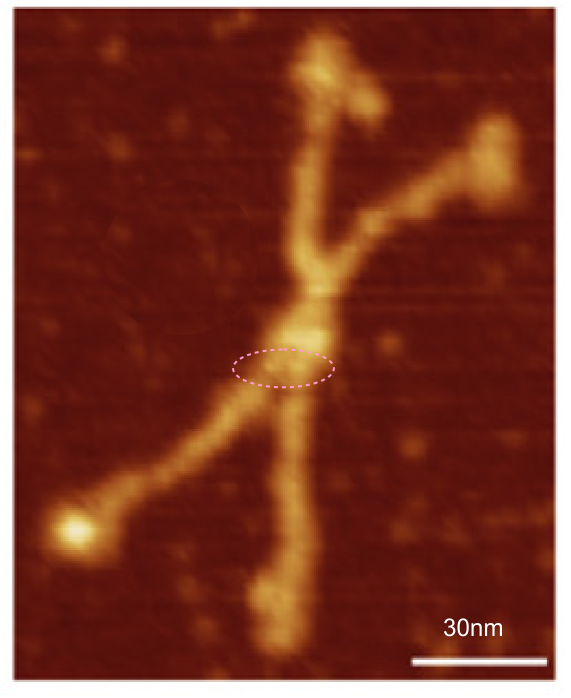
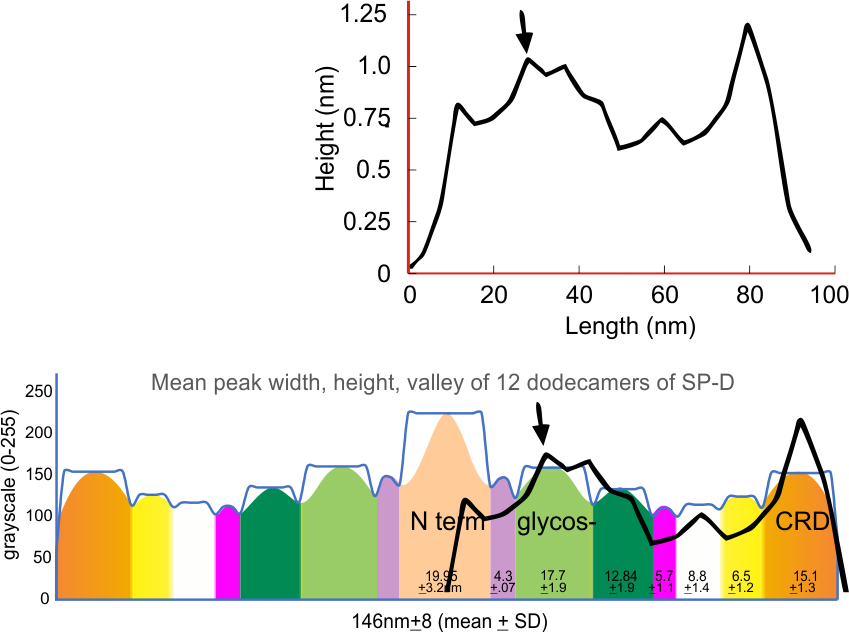
Figure below shows an original plot of surfactant protein D (Arroyo et al, 2020) presumably made by the program that comes with the Atomic Force Microscope that was used to visualize the protein preparation. Brightness on the y axis, distance on the x.
I used this plot as a “published” documentation of peak count of a trimer of SP-D. While looking at the images in this and other articles by Arroyo et al, I became convinced there were patterns in the brightness (peaks), symmetrical and mirrored, in the hexamers, dodecamers and multimers (though determining patterns of brightness peaks in the latter is more problematic than in the hexamers and dodecamers).
My own counts of peak number, and peak width were consistent enough that I sought out ways to verify the number and properties of these peaks in an “unbiased” way. (Of course there is no way to be totally unbiased in any research, but I did try to select image filters and signal processing functions that seemed appropriate, easy to use, and produced consistent data which I then applied in the same manner to 12 dodecamers of SP-D).
After more than 1000 plots of Sp-D hexamers, this figure (above) shows that not only are the three peaks defined by Arroyo et al, correct, but the tiniest variations in her plot that would not have been considered significant or relevant are actually verified as actual peaks (see the summary plot with which her plot is compared). This seems to me to reveal several things.
The reason that the N term peak is so large in the dodecamer compared to what Arroyo et al measured in their trimer is that there are four N terminals in a single (maybe not always single, perhaps sometimes side by side) peak that form the common intersection. All other measured peaks are a domains of a single trimer.
1. There is more to be learned about molecular structure from AFM images than is generally perceived, but this requires different types of image and signal processing.
2. There are many programs useful for defining or confirming peak number, width, height, and valley in plots generated by ImageJ that are free and easy to use and include signal as well as image processing apps (and both).
3. ImageJ has a great free plotting app for plotting grayscale values which is easily exported to excel and can be saved as metafiles and manipulated in draw programs such as CorelDRAW.
4. Resulting data here provides details which will assist those who are working to “finish” constructing the molecular model of human surfactant protein D.
