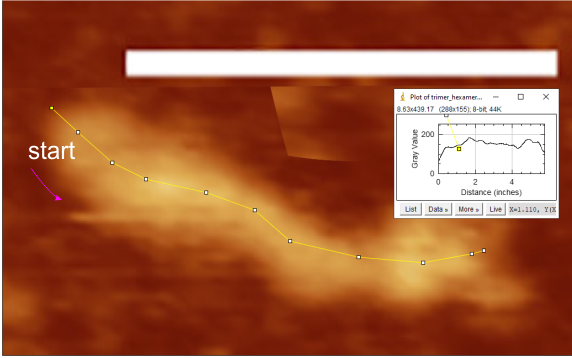
First plot of a trimer, for comparing the N term peak height and width in “trimers” vs “dodecamers” shows that the former domain peak to be about 11nm wide where the peak width for an N term in a hexamer is about twice that. When plotting hexamers which are part of a dodecamer all four trimer N terms domains are present, typically as single very large peak but sometimes with a tiny depression at the top of the peak.
to be sure there is no consistent difference in width between the plots of two hexamers of a dodecamer – hexamers alone need to be plotted.
The peak width of hexamers (plotted as part of a dodecamer – which was done here) is close to double what the trimer N term peak is and trimer peak height is about half the peak height of the N term peak plotted in a hexamer or dodecamer. It looks very much like an area 4x (so convenient).
One other thing to examine on trimers is the presence of a more pronounced “tiny peak” which may be more visible relative to a single trimer than four trimer peaks in a dodecamer.
It will take a lot of plotting to confirm this observation (which now is just an N=1), but certainly it was evident on this image. N term is on the left, plot starts on the left, CRD is on the right (typical two peaks where different floppy CRD might fall during preparation, glycosylation peak is close to the left. It is easy to count at least 8 peaks along this unprocessed image. mar marker is from the original (Arroyo et al, 2020) at 80nm.
