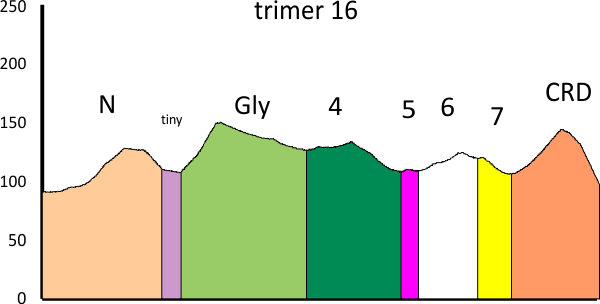
Last couple months I have been plotting individual trimers of SP-D to determine if number of peaks, peak heights, a valleys using the same 6 methods used on dodecamers produces the same results. The same 6 functions were use on trimers as on dodecamers (See list of image and signal processing functions used — at the end of this post).
There is clearly a smaller N term peak (N) in the trimers than the dodecamers where four N term peaks are “piled” or “linked” together. Other peaks do not change much, which is a good thing.
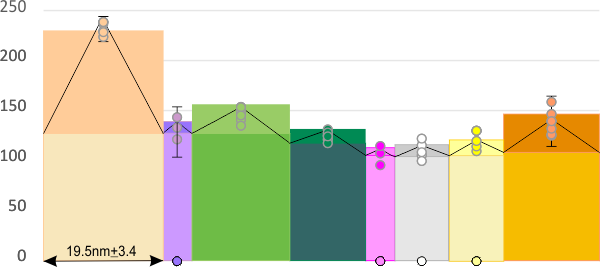
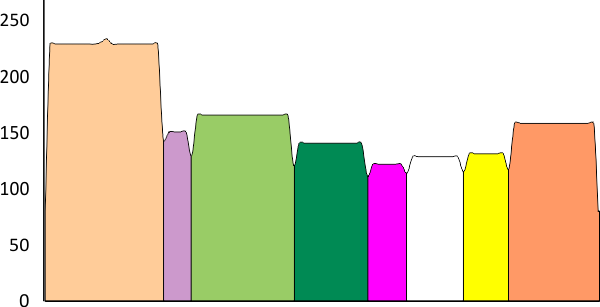
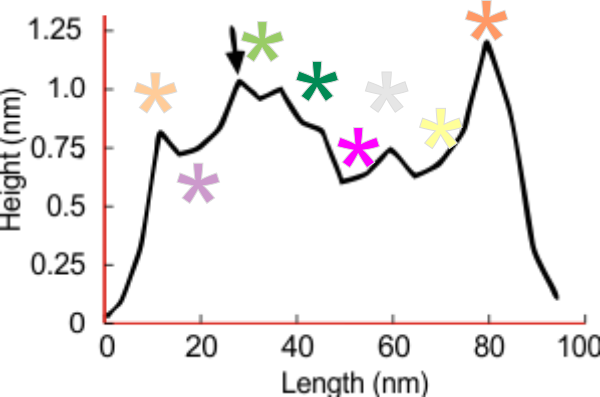
The plot immediately below shows just the peaks plotted for just one trimer (kind of a perfect one), and immediately below that plot shows mean peak height, width, and variation for 6 dodecamers (24 trimers, 368 trimer plots), and the third plot down is 14 dodecamers (56 trimers, 897 trimer plots) and the line graph below that is the plot from Arroyo et al, 2018 in which she identifies the N peak (peachie orange), the Gly peak (light green), and the CRD peak (orange) ONLY. My purpose was to show that there are at least 8 prominent, consistenly found peaks per trimer, not just three.
So many different images analyzed from different publications with Arroyo as author, are shown, ploted as dodecamers (6 or 14 individual dodecamers) or single trimer, there seem to be 8 peaks per trimer. Widest peaks are indeed the N, Gly and CRD, next widest and most consistend are peaks 4 and 6, the yellow peak (coiled coil neck domain) is infrequent, and during preparation for AFM is typically covered by the CRD domains flopping around, and also infrequent are the small peak called “tiny” because it is both thin and low (but consistently on the down slope of the N term peak) and peak 4 which is broad and rolling like the GLy peak, and a low and thin peak (pink), and a broad low peak before the coiled coil neck.
So after more than a thousand plots, I think I am pretty sure these peaks are part of the molecule and can perhaps contribute to creating a complete protein model of SP-D (which do date has not been done).
https://imagej.nih.gov/ij/
https://terpconnect.umd.edu/~toh/spectrum/PeakFindingandMeasurement.htm#ipeak
https://terpconnect.umd.edu/~toh/spectrum/PeakFindingandMeasurement.htm#findpeaksx
https://terpconnect.umd.edu/~toh/spectrum/PeakFindingandMeasurement.htm#Spreadsheet (s)
https://docs.scipy.org/doc/scipy/reference/generated/scipy.signal.find_peaks.html
https://stackoverflow.com/questions/22583391/peak-signal-detection-in-realtime-timeseries-data/22640362#22640362 (version: 2020-11-08)


