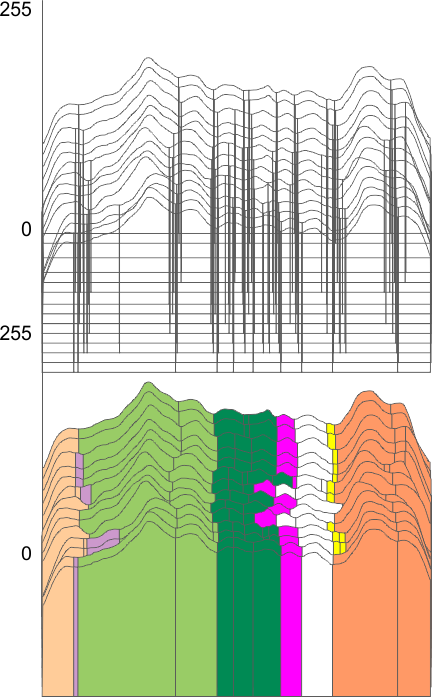
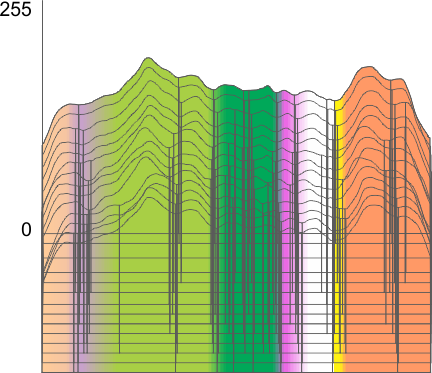
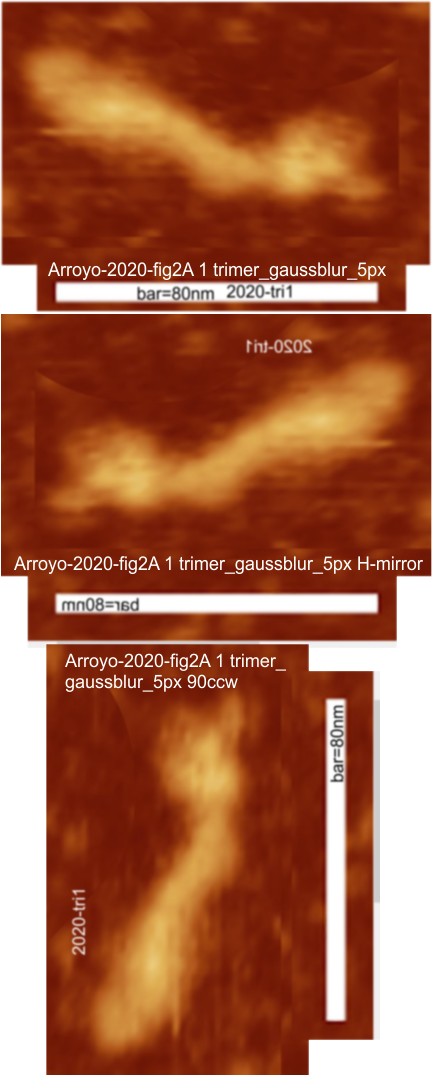
11 peaks found in a single SP-D trimer plotted 14 times, 90o ccw, left to right, right to left, and horizontal mirror (see AFM images below). The plot app was an excel file for finding peaks and valleys (PeakValleyDetectionTemplate.xlsx, the initial traces were done with a segmented line at either 1 or 5px line width using ImageJ. (Credits for the AFM of the SP-D trimer image, the excel file and imageJ have been given countless times in previous posts).
The ridge plot here shows the “alleged 8 peaks in a trimer”(found in previous data from plots of hexamers) as a backdrop to the “actually detected peaks for this single trimer by the PeakValleyDetectionTemplate.xlsx where I tried to use the actual plot lines (and their deviations) as a correlation with what has been seen with previous studies. N peak on the left; tiny peak=purple; glycosylation peak(s) typically more than one), bright green; peak 4 as yet undescribed with about 3 peaks or ridges, dark green; low and thin peak 5, pink; broad and low peak 6, white; neck domain peak infrequently seen, yellow; CRD domain peak typically multiple peaks (in this image 2 peaks) distinctly large and bright, orange.
 It becomes apparent that the concensus peak number for this single SP-D trimer is 11 (top ridge plot). My designations for why peaks could be sorted “down to 8 peaks” was made on the basis of hundreds of plots of hexamers (within dodecamers) where concensus was 15 peaks per hexamer, This creates trimers with 8 peaks, the N term peak being blended in higher order multimers.
The divisions of the colors from the actual plots (two of which I should obviously re-sort in retrospect but were made looking at the plots at the time they were traced (these being the dark green, pink, white columns aka peaks 4, 5 and 6 in the fifth and eighth plots up from the bottom).

