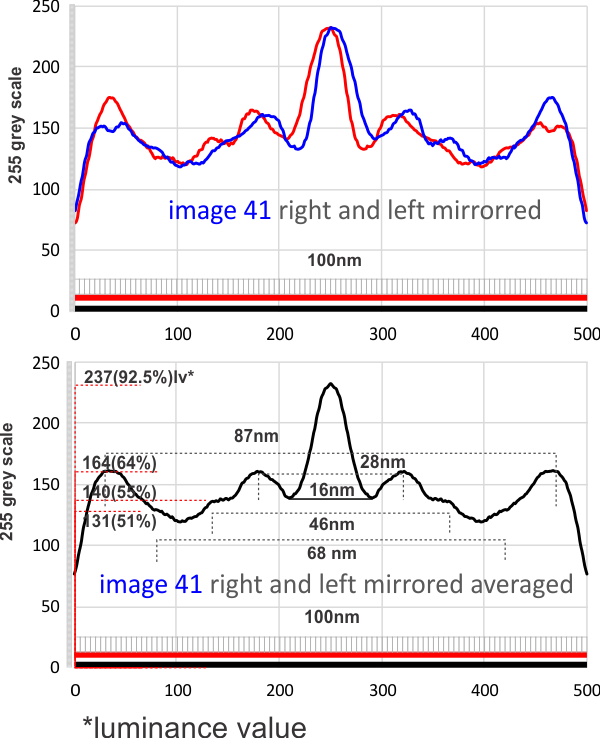
Measurements on surfactant protein D dodecamer images to establish whether there are three or two luminance-peaks between the center and the carbohydrate recognition domains.
Constraints:
1: No absolute measurements exist for the extended straight arms of SP-D dodecamers since the molecules fall in different planes, arrays, configurations, and bends, in preparation for microscopy. The assumption is (though the images published in scientific articles are no where near in complete agreement about what micron bars measure in those images) but consensus suggests that the near periperhal area of the rounded CRD from opposing ends of a dodecamer lie something around 100nm apart, and the whole dodecamer something just over 100nm. THEREFORE – this value (that is 100nm) is used as the standard and all molecules are aligned at that 100nm dimension and are cut into 1 nm vertical segments, centered and re-exported as 24bit rgb images at 500px in width. Distances between peaks and valleys along the arms are measured against the 100nm. It appears that exporting as 24bit rgb at 72 or 300 ppi tif images provides almost identical LUT plots given the same width (500) and height (20) pixel rectangular samples across the same image (at both 72 and 300ppi). However exports to 300ppi tend to minimize the effects of slicing and centering the original image.
2: No absolute values for greyscale luminance (also called brightness or intensity: measured on a scale from black (0, zero intensity) to white (256 [28]levels of luminance; grades from 0 to full intensity) exist in the images of SP-D dodecamers as posted online. Some are rendered in black and white from the original color of atomic force microscopy, others are actually shadowed and exist only in black and white. Some are converted from greyscale into RGB with no color saturation, others are converted from rgb to greyscale. Manipulation of the images (image processing) by the authors contributes to the greyscale attributes as well. I have also adjusted the contrast somewhat from the original publication images. It seems that an SP-D dodecamer photographed with AFM, exported to greyscale and analyzed with ImageJ (which plots greyscale values in its Analyze>Plot Profile menu shows a plot with its origin at 50 on the ordinate of a LUT plot, which is about 20% luminance.
Below is a plot in which 4 arms of a dodecamer of SP-D have been plotted for luminance, separately then averaged (TOP) and then vertically mirrored (8-10 plots total) and averaged again producing a symmetrical summary of a single SP-D molecule. There is a peak of about 159 lumens for the center (above the the 77 lumens background), 87 lumens for the first peak, 61 lumens for the middle of the 3 alleged minor peaks, 54 lumens for the smallest most lateral peak between the N terminal and the CRD and 88 lumensfor the CRD.
POSTED BEFORE:
1- central bright region 8nm and 94% brightness
2- First valley around central bright region 14nm and 121 grey scale brightness (47% brightness)
3- First peak on either side is 30nm (15nm on each side of center) and 71% grey scale brightness. and others can be seen…. three peaks between the center and the CRD.
