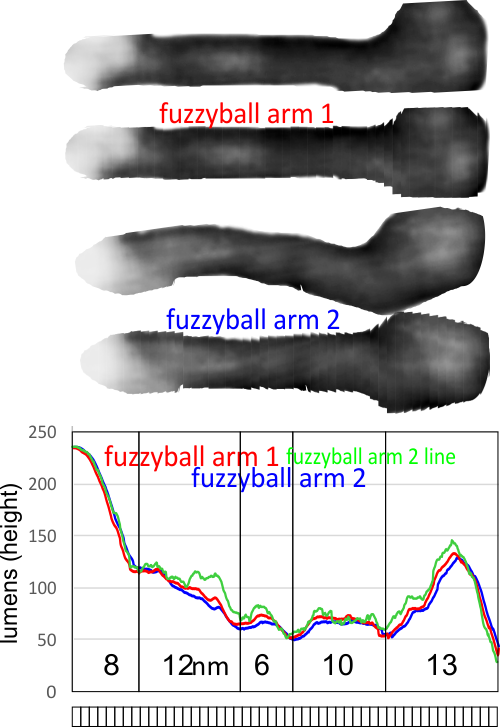
Revisiting an interesting idea (at least it interests me) is why there is a center in the surfactant protein D fuzzyball that has such an large “central gap”. After having plotted the luminance peaks (height) on a half dozen SP-D dodecamers I decided to approach the arms of a fuzzyball in a backwards manner, that is to measure it from the carbohydrate domain inward towards the N terminal domain and see whether the length and peaks along those arms were at all similar. The first fuzzyball that I measured (that is the first two arms of the first fuzzyball) had similar peaks, N terminal being the highest point at about 240 lumens (1-256 grey scale that measures the height of AFM images) and each peak (normalized to half a dodecamer (that is 50 microns) has similar numbers of nm accounted for in each of the typically 5 — not always — peaks from N terminus to CRD.
Top image — original from someone’s publication, two converted to greyscale and trimmed and one lightened in contrast to show the peaks, and bottom right, colored according the brightness, pink is the highest points measured, corresponding to the N terminus peaks and as seen in LUT plots of SP-D dodecamers. 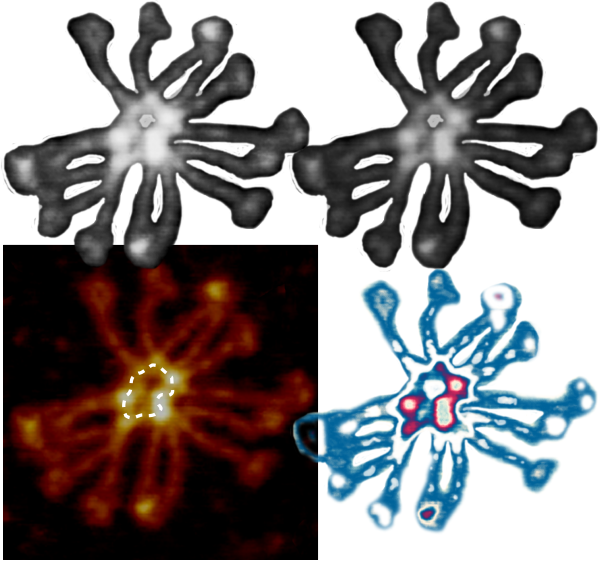
While I have not gone back to the original publications to measure the size of fuzzyballs (averaging CRD to CRD measurements as diameters, with the published micron markers I do know that the micron markers are poor indicators of what the actual magnification is… just sloppy measurements or perhaps real differences in size, but these are not my images so i don’t know. But I am assuming that the fuzzyball arms are not different in terms of AA sequence, and because they plot the same shape in luminance as do dodecamers, I am assuming that fuzzyball SP-D arms are a similar length (that would be @50 microns from N terminus to CRD)
Image below shows the fuzzyball analyzed, with 14 (though i acknowledge that one arm might actually be overlying a 15th arm… hard to tell) with a mean length (calculated according to the LUT tables and plot curves as mentioned from the CRD to the N terminus peak) a distance of about 22nm. This distance is actually as prominent (and long) as any measured peak in a single arm. In the image below you also see curved arms (which i did not use arc angle length calculations to straighten but just ysed linear distance which underestimates length. (i could do that but didn’t make the time to do so and even with curves underestimating length the mean was 44nm +/- 4nm and the remaining nm would not account for the center empty space in the fuzzyball which was anyway. Average diameter of the central dark area (covered here by the sqnm grid) is 22nm+/-2nm. The square nm of the empty space is about 300. grid beneath arm measures = 50nm width.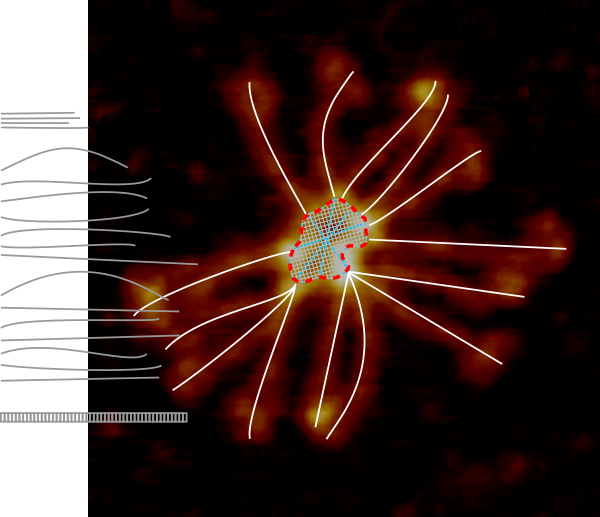
LUT plots for two arms (both on the right hand side of the first image) cut into 1nm slices, centered and plotted by either a rectangle or line in ImageJ are shown at bottom.
The bottom line of this post is that the N termini of SP-D are probably joined NOT end to end in a fuzzyball like they are in the dodecamers, but side to side. Why would they be different?