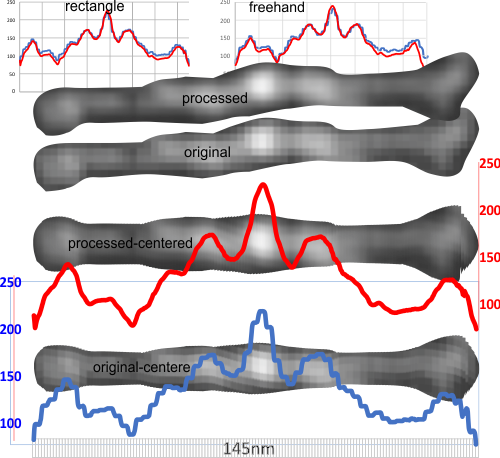
145nm +/-10nm is the current mean and SD of dodecamer arms (measurements of 41 different dodecamer arms from AFM images from Arroyo et al) and the image here which is from a low res cover image of SP-D molecules (also Arroyo et al), to which a Gaussian blur with a pixel radius of 3.5 was applied, and contrast increased, brightness decreased manually. Two opposing sides of a dodecamer (two trimers joined at Ntermini) were trimmed identically, cut into 1nm strips, centered and exported as tif files and a rectangle plotted in ImageJ.
The LUT plots for these images — that is, gaussian blur and centering and contrast enhanced vs a screen print of the same dodecamer from their cover — are virtually identical, one pixelated one more pleasing, very little change in anything except smoothing of the LUT plot and more pleasing visualization.
CONCLUSION: gaussian blur doesnt change the image grayscale data (obviously absolutes yes, but not relatively) and the centering makes data easier to plot in ImageJ. Thus, except for the fact that the original cover image does NOT have any micron marker and the diameter of the dodecamers will be summed for an average size for those images only, they are still acceptable in a database that will be used to determine whether there are three or four LUT peaks (height in AFM) in the collagen-like domain. plots on top left, rectangle of centered images, plots on top right, freehand line where the peaks are chosen during drawing. One can see that the centered freehand has a higher peak value than the rectangles. The problem with freehand is that it does NOT represent an unbiased assessment, nor does it reflect the average over the vertical 20-25 px. The good news is that there is no method which obliterates the data, thus whatever method you choose to analyze the peak heights (brightness as percent or 0-255) you will likely have reasonably representative results.