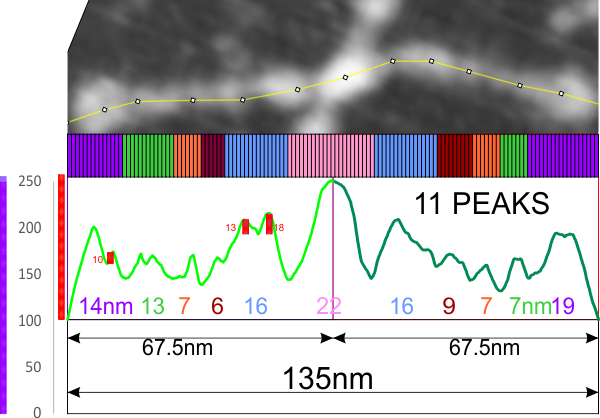
It appears that there are directional lines and background noise that can cause significant peaks to appear in LUT plots. THe ways that I think that one can counter these are:
1. determining whether there is isotropy/anisotropy Most clearly the lines in an example below show that measurements along .
2. Orientation (as well as image processing) impacts measurement since all these molecules (hundreds of them) have been observed in countless different positions, fallen by chance into as many different configurations influenced by preparation, pH, molecule density, interaction between different parts of different adjacent molecules (e,g, N termini with CRD, CRD with those from other molecules), multimer number, and positions with regard to — staining techniques, shadowing techniques, warping of the surfaces, and variations in support surfaces, and of the beams and cantilevers, not to mention the influence of image processing, such as digitizing if images are not already digital, which includes many different algorithms just touched upon in this link, in converting to grayscale, loss of resolution during resampling, brightness, contrast, and some inevitable distortion with making figures and that doesnt include the outright mistakes. So all these influences can perhaps be minimized or equalized with sample number and repetition.
3. Variation in length of the SP-D arms can be reconciled in several different ways, of which one is to normalize (which I am using) each half of the hexamer to a center point in the Ntermini joining, and an extinguishing grayscale point just after the CRD on either end of the hexamer.
4. Determining in each image the background variations in grayscale (brightness) to determine what constitutes a “background” peak not to be counted as part of the dodecamer, is pretty time consuming, and it begs the question whether the AI is better than the EYE.
5. I seems to me like finding out the background in each image is probably the most precise way to approach the variation inherent variation, and of course that can be taken to an extreme too.
6. If a grayscale of 0 – 255 is used then a significant peak would be close to 13 units in the ideal case. There are clearly times when background is twice that value. Image below shows a relatively large peak (38 or 255 grayscale) where the CRD (a portion of which appears on the right hand side of the image is just over 141.6 units. 
This image below (posted again from earlier this week) shows two examples of where the peak and valleys might be actually be reflections of underlying extraneous grit (lol). The peaks of 13 and 18 grayscale units could be debris. I guess the bottom line is sample after sample and a gradual sorting out of what is “peak” and what is not.
