Just going back to cover the steps in analyzing the micrographs of SP-D (as painful as that is) makes me pretty sure that the variations in grayscale value (even in the RGB which i thought originally was monochromatic representation of the AFM images) there is very little difference in the way the molecule gets measured. THis is comforting. Means, SD, and t tests indicate that not much changes in terms of measurements of the length of the dodecamer arms using different algorithms for color to grayscale.
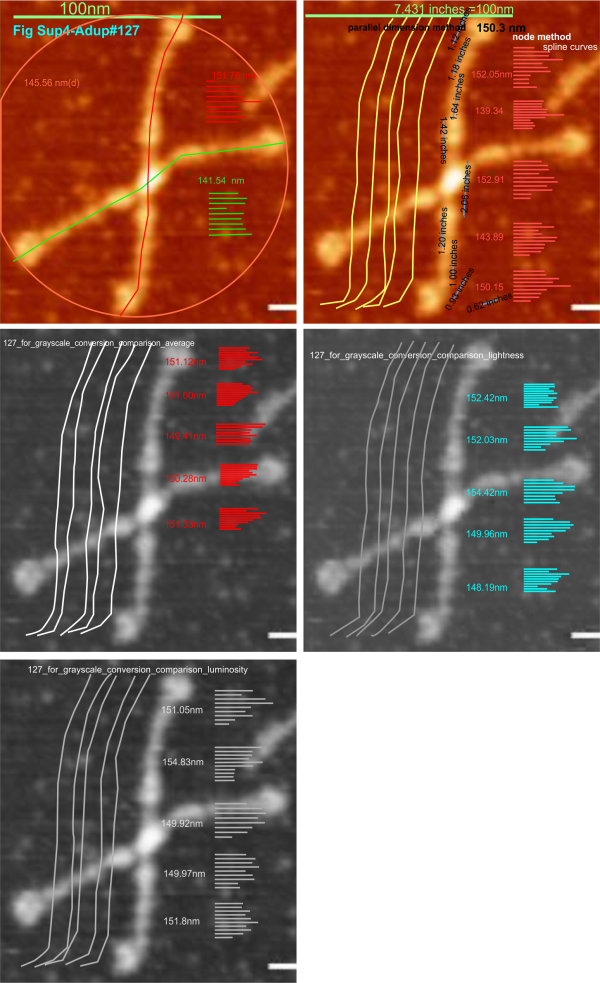
Image above is one from the publication of Arroyo et al that i have quoted literally hundreds of times, and have designated #127 (and appears also in the Supplement Figure 4 of their publication). I chose the longest arm of this particular dodecamer to determine if the length of the arm changes with manipulation of the image. This longer arm is about 14nm longer than the average found by measuring over 150 hexamers indepently. (see previous posts). Upper left, the original data (diameter, and each arm measured separately), upper right, duplicate to see if there is significant variation in the way i create the spline curve to measure, and also a measurement of the segmented line using the parallel dimension tool (neither/either works as well, the former is easier to record individual line lengths so that is what i use). Then middle left middle right and lower left are grayscale conversions using “average” “lightness” and “luminosity” algorithms. THe length was measure 5 times independently in each case. Clearly, too little (and using t-test found not to be significant different from the color, and among the grayscale images) variation was found to warrant more data.
That said. I will test these same five images for differences in the LUT plot “peaks”. I do anticipate differences in peak height and peak width BUT, not in the NUMBER of peaks along each arm. Background peak height will be found for each image separately as well. We will see.