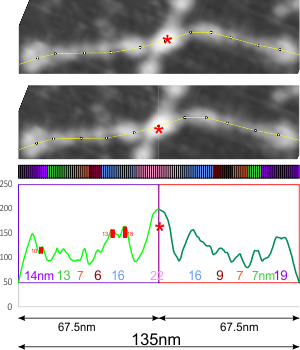
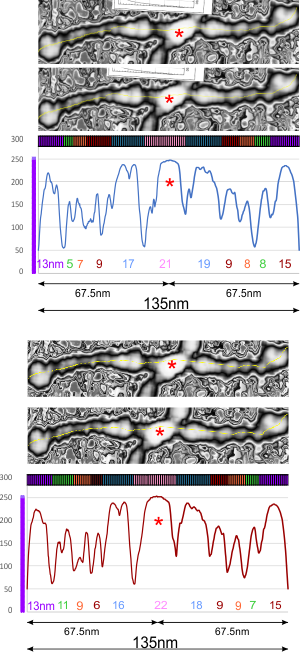
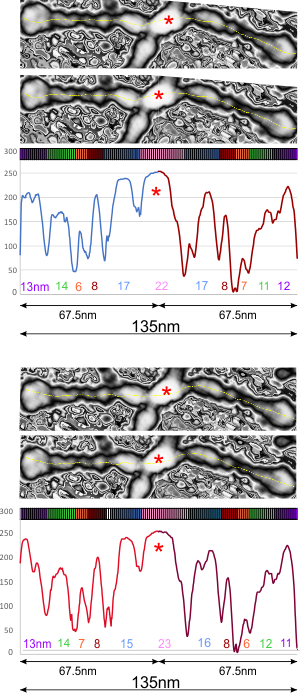
Three variations on the measurement approach, basically provide the same results: there are very likely 4 peaks between the Ntermini junction and the CRD in a dodecamer arm (one-hexamer end to end).
Figure below is the original image (arroyo et al, i think the supplemental figure 4A), converted to grayscale using ‘luminosity’ which in my opinion provides the best contrast and brightness but the algorithms for that process i have not looked up. Using FiJi (Image2 update) I gathered brightness peaks using the LUT table plot menu. The plot arm along each hexamer (CRD to CRD) is shown with a crop of a screen print. The data were saved and plotted in excel. Each hexamer center was found and each arm adjusted to (images and plots alike (red asterisks for original and adjusted – top image is “as is” bottom image is halves equal to 67.5nm — of a whole dodecamer of approximately 135nm). Then using gwyddion i image processes (they call it data processing on their menu) and resulting image i inverted in photoshop and analyzed for peaks along the collagen-like domain using FiJi. In this case that domain has four peaks. There is some question whether the peak just before the CRD could be the coiled coil domain. It is very commonly a cone shaped with the wider part just before the CRD domains would bend and partially hide it. (visualize – the cone part of an ice cream cone). I mention here that there is an angularity to the peaks that actually i have noticed…. i might measure that declination.

Processing the image in gwyddion in my opinion (all kinds of processing applied) really didn’t help define the peaks. No better in my mind than just using photoshop or corelDRAW to adjust the contrast and brightness. Had different data emerged i guess that would have been interesting, but since it did not, this adds credence to the plots obtained in grayscale conversions (with out additional algorithms applied) as being true to the original scans, and containing the same details.
This particular image which i have worked over and over is not really the best nor the worst AMF of a dodecamer, it is pretty run of the mill.
Images below show the vertical and horizontal arms, with LUT plots from the processed image, in duplicate, and each centered, and the nm of each peak is colored as well as given in text.

