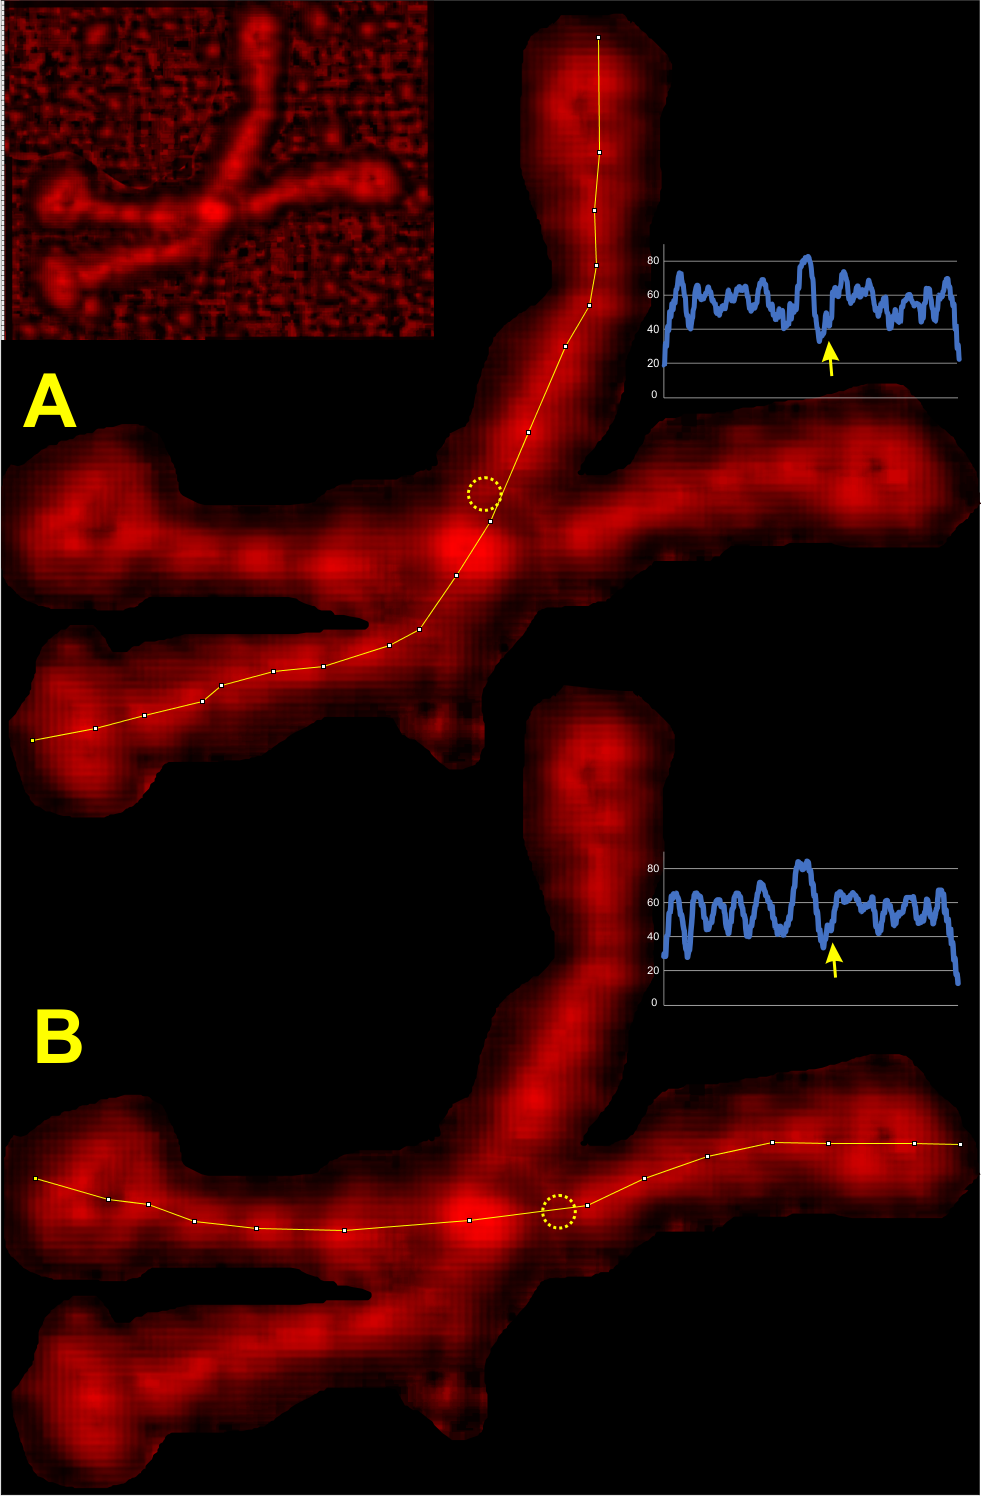
16:6:1 (settings for presentation>local contrast> kernel size (16) pixel depth (6) weight (1) in gwyddion) and a second set of settings 16:4:1 might be the bests processing for registering peak height that i have found. it doesn’t just seem to be a brightness contrast change as available in photoshop. I dont know the algorithm but bet that an online gwyddion chat group could provide them.
What i observe from the LUT plots in imageJ after being processed for data processing>presentation>local contrast? 16:6:1 that the plots have each of the suspected, regular, peaks at a value that can easily be counted. So in this particular image (also from Arroyo et al) the “best fit” plot for what my eye tells me is the left side of of this particular dodecamer, in particular the lower left arm. The real work comes in figuring out “what are the odds that this molecule will fall into perfect alignment to predict peaks along the collagen-like-domain” Each LUT plot beside the tracing in imageJ. Please not the little yellow circles = aka “new peak between the Nterminus and the alleged glycosylation site”.
