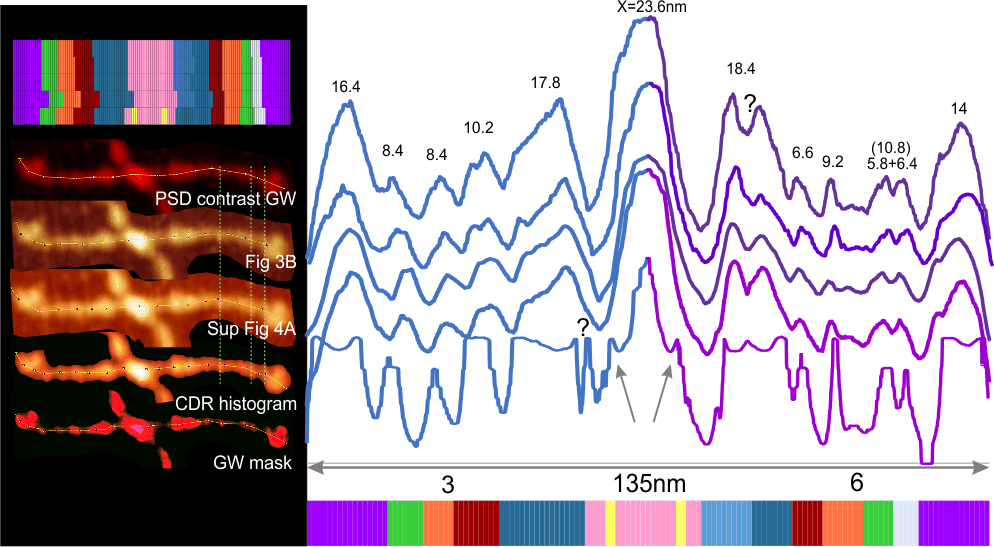
Using images of an SP-D dodecamer from a published paper and its supplement (Arroyo et al), and using various methods of masks, histograms and contrasts, and the same hexamer of that dodecamer plotted (with actual segmented line of the plot seen in images below) in ImageJ, the results show that while smoothness of the plots, and heights of the peaks are different with each image processing method, the results are pretty much the same, with one exception.
There are easily documented LUT peaks (three of them) between the N termini junction and the individual CRD of each of the trimers (view left hand side of the plots and images), and there is a very small peak (which i have mentioned in some recent posts) that is on the down slope of the N termini junction peak (see the mask-image performed in Gwyddion) which shows one on each side (bottom plot, image and color representation of the nm width of each peak).
The right hand trimer of this particular dodecamer which is plotted on the right side, show additional and what are likely background vibration peaks… which impacts the number of LUT peaks (adding three variable peaks). A LUT plot of the background of the second image from the top shows a periodic background peak of about 7.2nm in the original image, appearing at a slight angle in the cropped and rotated arm images, but none-the-less visible.
Because the background vibrations that appear in these images are random with respect to the direction of the arms of the dodecamer as they fall onto the mica… using both arms for LUT plots, and many variations in image processing, as well as many images, the background peaks will eventually become less relevant.