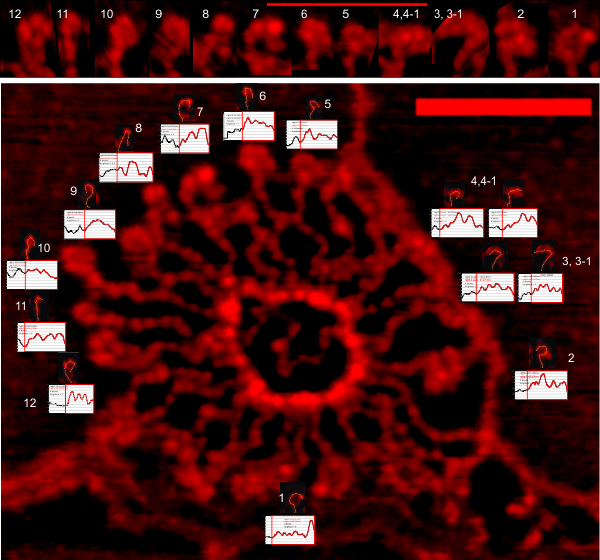
An image provided to me to “look over” is in fact a wonderful gift (non-tangible, unexplainable, artistic, important). I have spent a couple months trying to decipher what this protein actually might have as a consistent shape in its numerous arms. So i decided to look at one place where I thought i could tell there was a pattern in brightness peaks, and that was the “hook” at the end of each multimer.
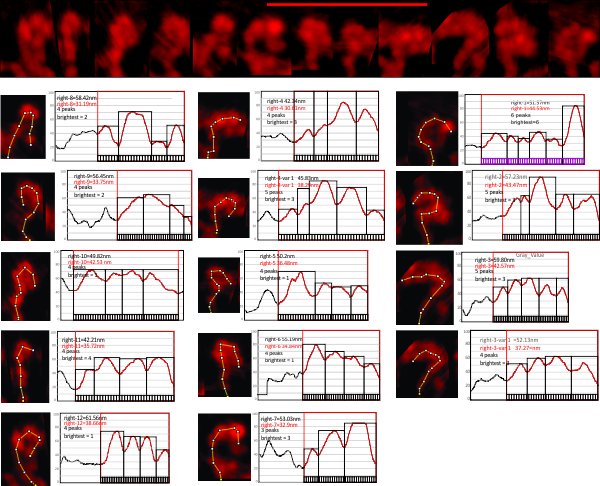
image below has had the “hooks” cropped out of the original image (which stands as i have named it –round_1_orig_cropped_300ppi_psd_high_pass_250_gaussian_blur_5_px_limit_range_100-255 which means that it is the original image, increased to 300ppi in photoshop, and then to it applied a 250 high pass filter, then a gaussian blur of 5px, saved, then opened in gwyddion and in the latter, a limit ranger algorithm for basic operations>limit range (100-2555) applied. Images were cut and rotated in corelDRAW, then exported as a single image straight line, each identified from right to left with their tracings and their plots. ImageJ was used to create the tracings (segmented line), brightness peaks (plot profile). Plots saved to excel, imported as metafiles in CorelDRAW, and the brightness peaks kept relative to 100% and the x axes as nm according to the original bar marker. Bar marker was retraced with each segmented line of a hook area.
Mean peak width (+SD) in the area plotted in the red box with the plot line in red (n=14, 36.5nm + 4.39); mean number of peaks in a hook (n=14, 4.2 + .69); right to left, the width of peak 1 (n=14, 9.5nm + 2.7); width of peak 2 (n=14, 7.28n + 2.4); width of peak 3 (n=14, 8.85 + 2.4); width of peak 4 (n=13, 8.30nm + 2.7); peak 5 (n=5, 7.2nm + 1.9); It is possible to begin at the most right part of the tracing and count highest peak in that direction rather from left to right…. go right to left. All tracings were done in the same direction from a portion of the molecule’s arm to the end of the hook. It is clear that a few of these have some ambiguity in where the hook hooks up to the arm…. that was a judgement call – in particular hooks labeled 1, 3 -5. 3 and 4 were traced twice. Whether one bright peak was actually two spots was also a matter of judgement occasionally, but a 5% change in brightness was used to determine whether a peak was significant. 
 If i take out the duplicate of plots 3 and 4, and delete odd plot 1, then the picture is much clearer. peak number (n=11, 4.09 + 0.5); peak total hook width (n=11, 34.65 + 3.8); brightest peak is either peak 1 or 3 (occurrence is 4 each out of n=11); peak 1 (n=11, 9.72 + 2.8); peak 2 (n=11, 7.8 +2.3); peak 3 (n=11, 9.0 + 2.44); peak 4 (n=10, 8 + 2.93); peak 5 (n=2, 8.5 + 2.5). It looks like the brightest peak might be a little wider (obvious) and the the hook is 4 peaks.