Arroyo et al is perhaps the gold standard for measuring SP-D. I keep coming back to this publication as the most apt to be correct in terms of measurements of surfactant protein D and while my intent was to go back and measure all the other images against each publications’ bar marker I am pretty convinced that the measurements from Arroyo et al are probably the best to use.
Comparing my analysis of a single dodecamer that appears in that publication and their analysis is interesting. I have used their micron marker as a scale bar for my analyses.
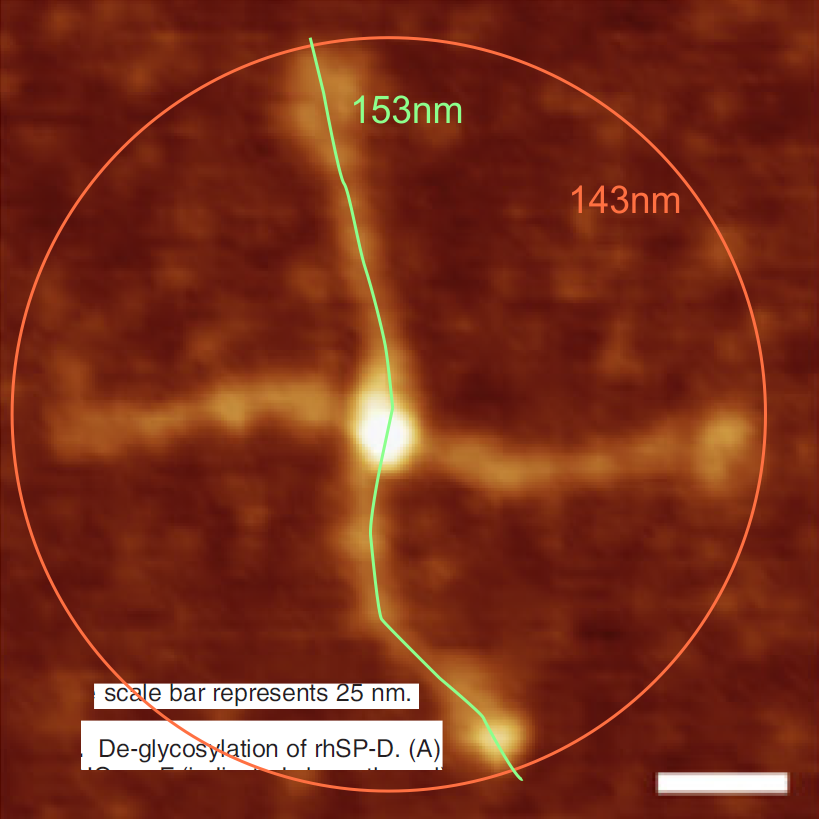
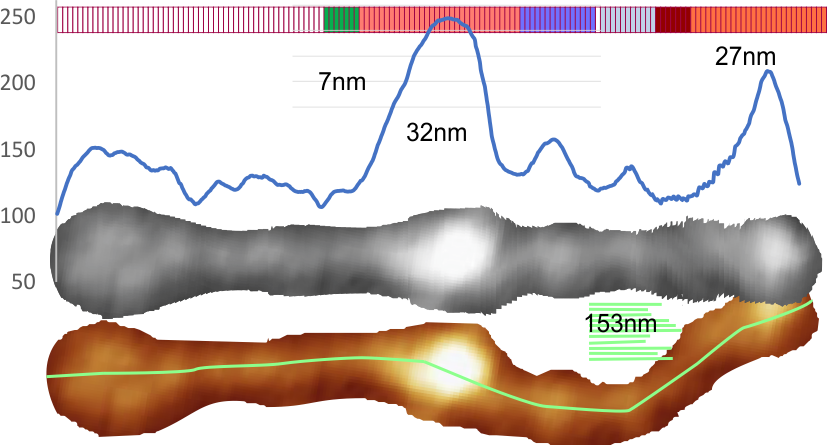
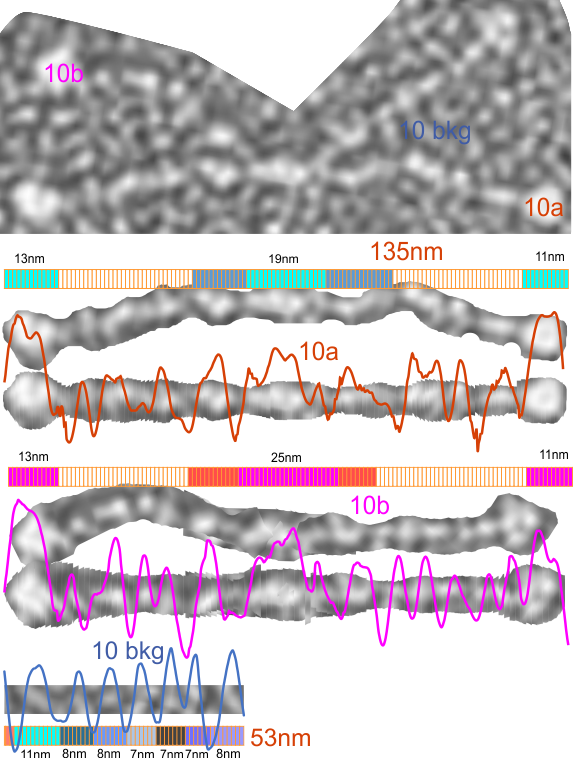
1) I have used a circle to estimate the size of the dodecamer (three out of four of the CRD are touching the circumference. Arroyo calls peak 2, which is likely the peak that i call collagen-like domain peak 1 (because it is closest to the Nterminus) is variable in width but almost always less than the Ntermini peak of a dodecamer (as seen in Arroyo’s LUT (or height) plot and in almost all of the LUT plots that I have made as well. This peak is the brightest in shadowed images using TEM.
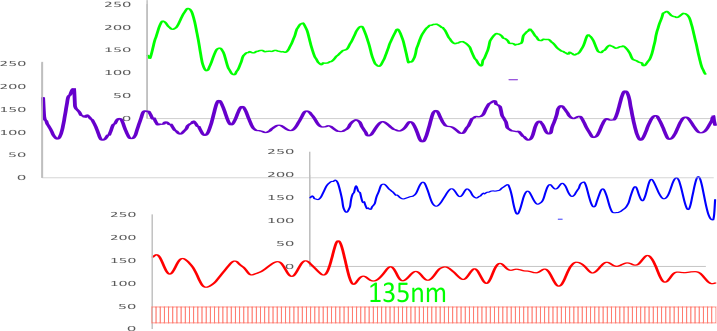
2) From peak 1 of the collagen-like domain the measurements (using 148 as the diameter of this molecule) is about 40nm and mean valley to valley of the two individual collagen 1 peaks in this particular molecule is about 20nm. The width of the peaks in Arroyo’s graph for CRD is about 28nm (using my 148nm diameter based on their 30nm bar marker).
3) Since this molecule is made up of identical monomers (12 of them) and since the Ntermini peak is NOT in the center of their plot (nor is it in the center of my LUT plots), I think that it is perfectly reasonable to “force” the half plots into equity. It is easy to see that the collagen 1 peak in the collagen like domain is wider on the side where the arm length is greater so i think that normalizing each side to “half” the distance would be a good (and fair) way to minimize the variability in size (which is most likely due to random falling onto the substrate during preparation (that is simplistic, yes).
4) the segmented line measurements are very close to the diameter measurements (case here where diameter of 148nm and segmented line measurements are 148.5 for the single arm measured is quite close. It is the same arm measured by Arroyo et al, who came up with a measurement of 160nm which might be a little long.
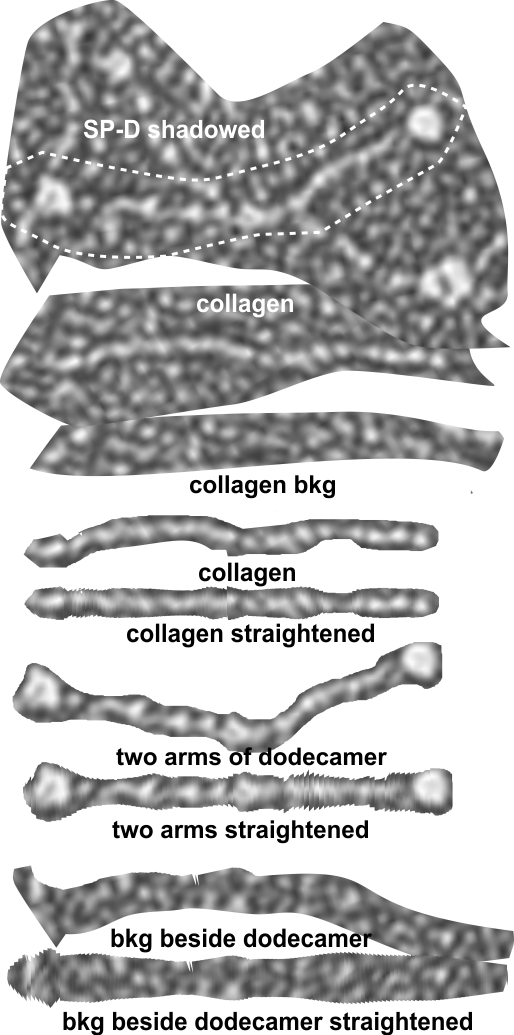
5) the third image (set of images) on the top row (left to right) show the same arm of the dodecamer cropped out, then sliced into 100nm (approx) segments, and those segments are aligned horizontally (technique described before on this blog) with the resulting image exported as tif for LUT tables using ImageJ. (that straightened arm is shown as the right-most image).
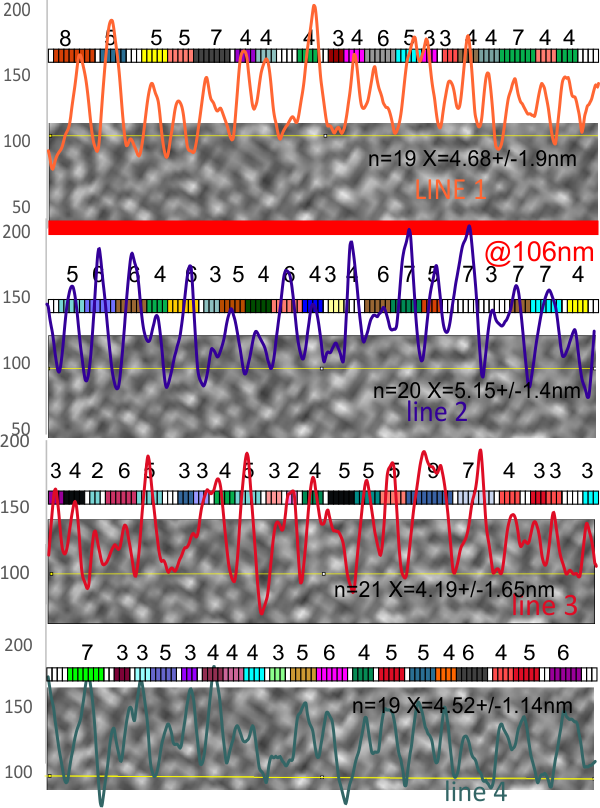
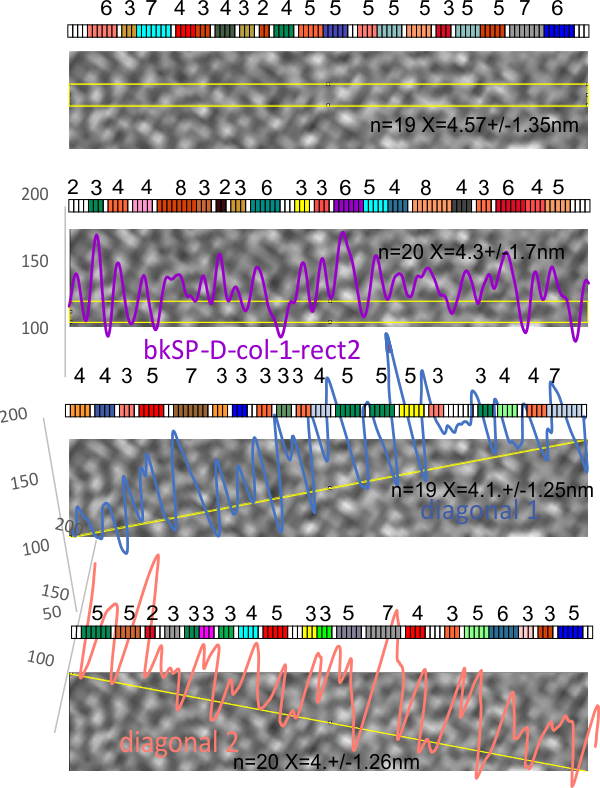
6) of all the dodecamers I have plotted, this happens to be what I called #43, labeled as such, and the two sets of arms are labeled a,b and c,d so that plots of each can be compared. I derived LUT tables from a) a single line (as per Arroyo) and as a rectangle in ImageJ. There is some smoothing obtained by using a rectangle, but both methods produce pretty much the same results, just like the diameter vs the segmented line (measured twice, once in the vertical image, and once in the original analysis (red segmented lines at the base of the plot) to measure arm length are very close. The former is way easier however.
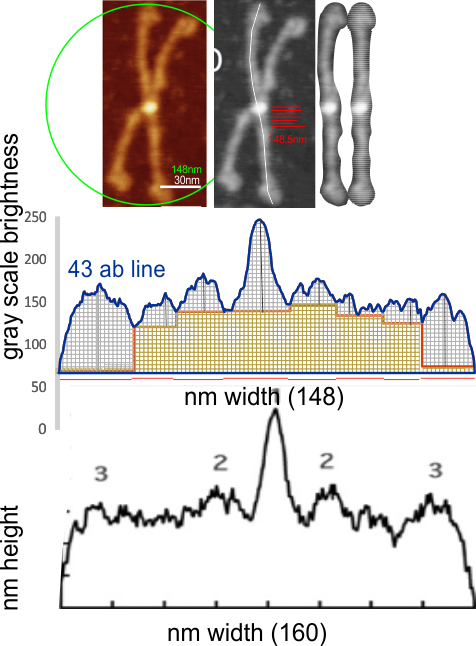
7) background was subtracted from the peak height (brightness or lightness, formerly lumanance) at the lowest point in the LUT tables within the molecule.
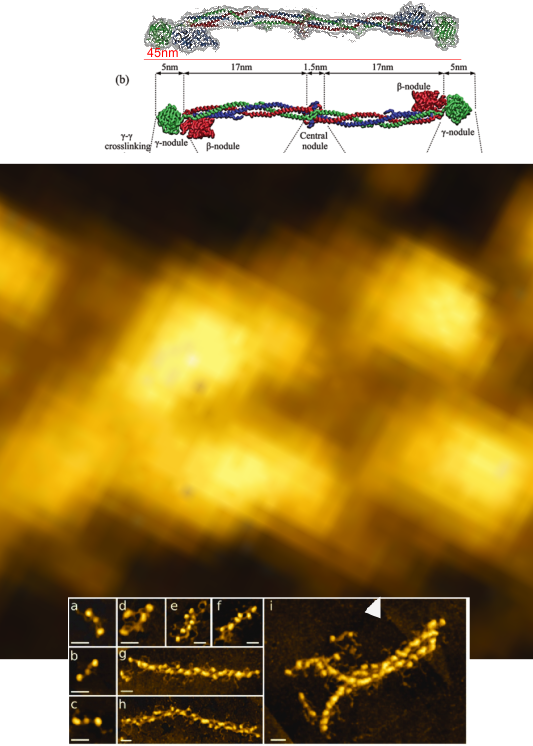
8) sq nm were determined for the CRD. and the plot height and area as well. All in all, i think there are some additional facts (namely two additional regularly occurring peaks in the collagen-like domains) and relative peak heights and areas as well as a simplified method for calculating the arm length of multimers of any kind (using both shadowed and AFM images, particularly relevant to those which form multimers like SP-A, SP-D, conglutinin C1Q etc.
9) comparing shadowed and AFM methods, and information derived from each (which is better? or more informative? only careful comparisons will tell. IT seems to me however that using the AFM for comfirmation, that the shadowed image show almost as much about the SP-D molecule as the AFM does. Maybe it is a little harder to ferret out.
I will say again, Arroyo did some nice morphometry…. for that i am appreciative. I dont think the resolution of their LUT plots (nm height but likely equivalent to the grayscale or LUT plots or relative sq nm in some measurements I have made) the are very conservative in choosing only one peak in the collagen-like domain…. I think consensus would say there are more.