IN this set of data there are (‘ or is’ – to use the noun as a ‘group of data’ (the latter is probably correct – “Merriam-Webster entry for “data,” notes that both singular and plural constructions are “standard” in English. and as someone posts… “anyone who ‘corrects’ you for noncount use of ‘data’ is being pedantic (and probably rude)” LOL, peak numbers along two hexamers of SP-D.
One image of a single SP-D dodecamer (which i call #51) (from a publication by Arroyo et al) was image-processed with 16 filter variations coming from a half a dozen programs, then analyzed for “peak count” (or “LUT” peak count (aka “grayscale 0-255 brightness”) by 2 visual and 6 different signal processing algorithms. The purpose is to determine how reliably the number of bright peaks along molecles can be counted in traditional AFM images.
Image processing does change the counts somewhat, but in all plots there are similarities in relative numbers and sizes of peaks regardless of the graphics programs and signal processing algorithms.
The two arms of this dodecamer (51) are clearly different in terms of arm length (artifact likely from stretching and twisting as fell onto the mica). The arms are significantly different in the number of peaks per hexamer. One could think that stretching one side of the dodecamer could be useful artifact, since squishing of arms would obstruct definition between and among peaks.
Peak values were obtained as follows using the original images processed with 16 different filters. Filter names are given below: Clearly the filters that increase contrast or mask outliers show different results.
1. Visual count (by eye – after each processing filter
2. Quick count of the peaks in the LUT plots obtained in ImageJ plots (no background subtraction)
3. Batch Process – (an app for excel files that uses dispersion peak detection to detect peaks in the LUT plots obtained in ImageJ) – (lag=1, threshold=0.5, influence=0.025)
4. Batch Process – (lag=1, threshold=0.1, influence=0.01)
5. ImageJ – Find Maxima>0.5>strict>single point
6. ImageJ – Find Maxima>1>strict>single point
7. ImageJ – Find Maxima>2>strict>single point
8. ImageJ – Find Maxima>3>strict>single point
Methods 1, 2, 5, 6, 7, and 8 use the image directly, while Batch Process uses the excel files from LUT plots.
Top figure = image processing filters


The color of the dots indicates which program was used to count peaks, and the number on the x axis corresponds to the way the image was processed before peaks were counted.


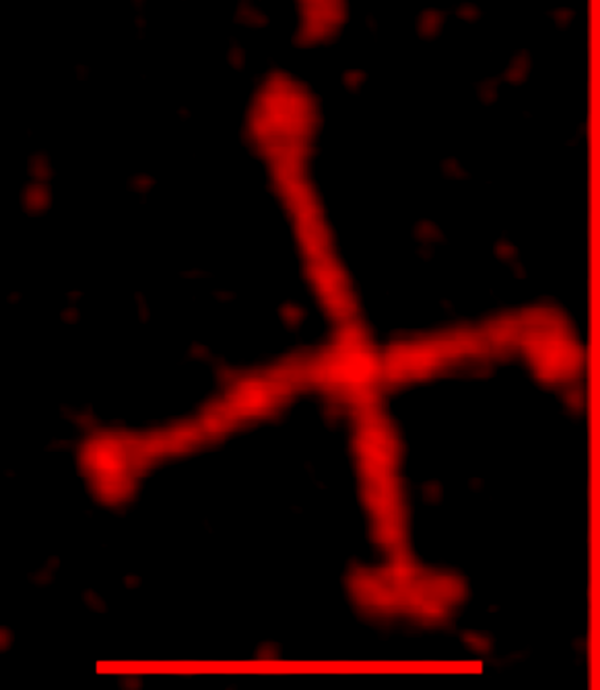
SP-D dodecamer (from Arroyo et al) above. Arm 1 = middle left to middle right, arm 2 = top middle to bottom middle-right.
Interestingly, my eyes see more peaks than are found with image processing. And second to that is the number of peaks that appear in the LUT plots (ImageJ) in a quick count (without subtracting background). Summary counts or all processing (hexamer 1 and hexamer 2) are probably pretty close to reality.
I need to find out what ImageJ uses for finding maxima … and find a good definition for Lag, Threshold and Influence.
Just an aside….. It took me an insane amount of effort to learn the programs, and to obtain and organize these data (and i need to add Octave to the list of programs)… LOL, but i think they are robust enough that using the same (or similar) scripts on numerous arms of SP-D and DMBT1 will be valuable in sorting out the LUT number of peaks per trimer.
Were I going to choose three methods to analyze additional molecules I likely would choose: 5, 6, 8, 11, and/or 16 for image processing, then Batch Processing LTI 1, 0.5, 0.25 and ImageJ (Find Maxima 1 strict) for peak counting.