Peaks per hexamer were counted three ways –
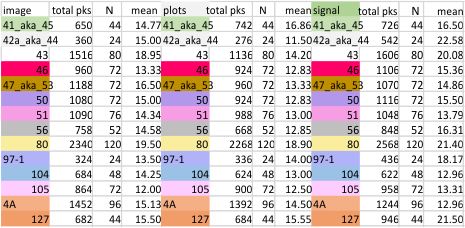
1. IMAGE = my counts of bright spots in the AFM image (aka peaks). This was recorded for each trimer, hexamer, and collated for each dodecamer (N=14), and for each image processing filter and for each signal processing function.
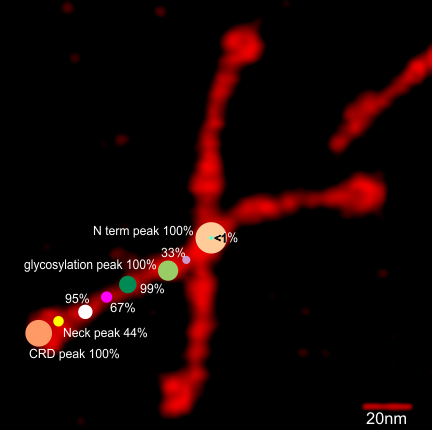
2. PLOTS = my counts from the “image” of each of the plots created by ImageJ from my trace through the center of each hexamer in the direction of the CRD peak to the opposite CRD (as in, end to end). Directions of the segmented line through each hexamer were ALWAYS traced in the same direction (left to right) for all the peak finding and peak counting apps.
3. SIGNAL = peak counts were generated from 5 approaches (Python/Scipy app, Stack Overflow app, Octave (two functions; ipeakM80, AFPPxy), a PeakValleyDetectionTemplate.xlsx) each using using the same grayscale .csv files created from traces in ImageJ.
SUMMARY
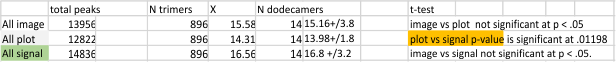
My peak detection from the actual image consistently consistently fell between counts from the plots themselves, and the peak count generated by signal processing functions. Mean peak counts from three methods continues to identify 15 peaks per hexamer.
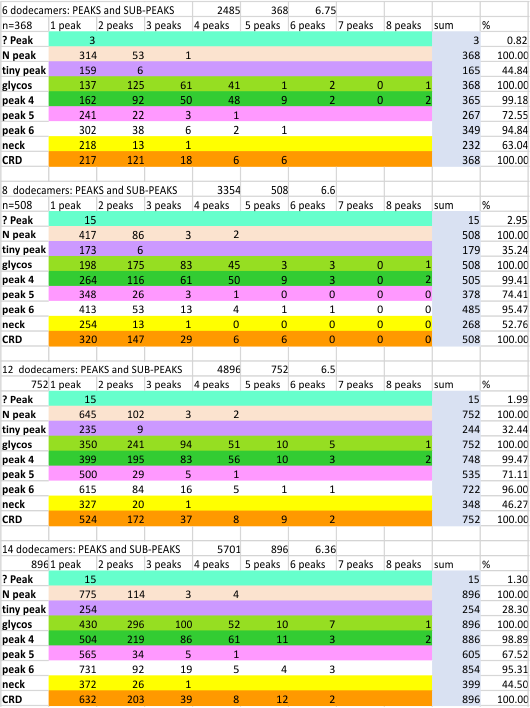
Summary table below shows both the individual values (896 trimer counts and all processing types), and individual dodecamer counts (N=14, X+/SD). (image=my counts from each image) vs plot (=my counts from each plot from each image recorded by ImageJ). These two counts are not significant at p < .05. However, there is a significant difference between my peak counts from the ImageJ plot and the peak counts that is tallied from the signal processing functions. ( p-value is .0119); There is no significant difference in the number of peaks found when I count peaks directly from the image vs the number of peaks found with signal processing. Results with an N of individual trimer counts (N=896), and the mean and SD from counts from each dodecamer (N=14).
 data for 12 dodecamers is here.
and comments from a previous post here.
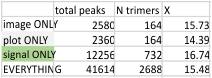 The graphic above separates the peak finding into separate categories (highlighting the vast majority of the counts were from signal processing functions). It shows total peaks counted from the image itself (image ONLY), and my counts of peak number from the plots from those images (plot ONLY), the peak counts after all signal processing functions (none of my counts)(signal ONLY). The bottom row is all counts all methods, all the time (EVERYTHING). LIttle variation, basically the same number as found a year or two ago. 15 peaks per hexamer