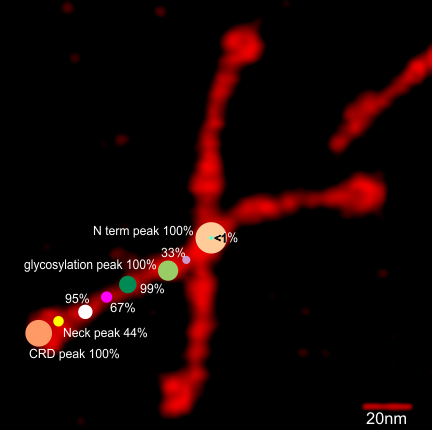
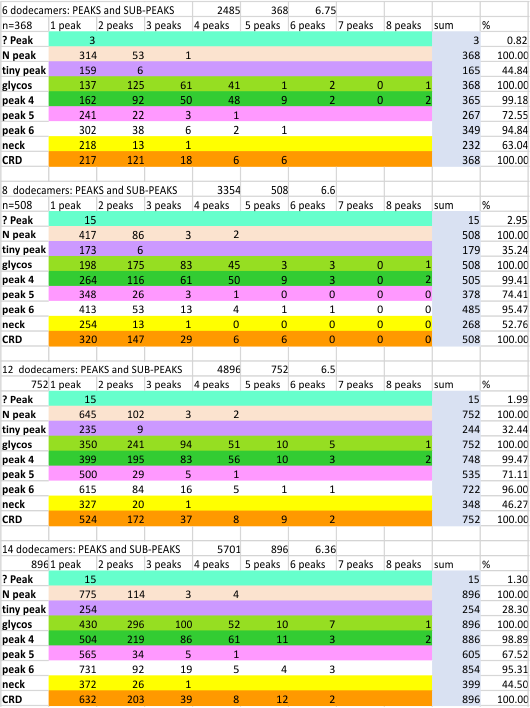
Four sets of data are below (gathered incrememtally – from 6 to 14 dodecamers) were examined for number of peaks, and sub-peaks per trimer. Each dataset includes the molecules from the prior set, i.e. the same initial 6 are part of the new 14 dodecamer data. An image of one of those 14 dodecamers analyzed is shown below with color-matching circles of where the 8 peaks per trimer are align on the molecule. You will count 9 dots. 
The initial number of peaks per each hexamer in a dodecamer was found using signal and image processing on many occasions and using over 1000 plots. That number influenced the division of each plot of a hexamer – but ultimately using the plot from the image and the peak detection plots as a resource for that division. The sub-peak of the N term peak detected in dodecamers was detected less than 1% of the time (very pale green), (but may be more prominent in multimers), and the peak called “tiny peak” (purple) on the downslope of each side of the N term center peak was detected about 33% of the time. These were data were included when they appeared.
At opposite ends of the hexamer the CRD peak (dark orange) and neck peak (yellow) occur. The neck peak is sometimes concealed by the overlap of the CRD peak(s) (which in seem to be a flexible part of a largely rigid molecule), and can lie during preparation in a floppy cluster obscuring a nearby neck peak. The neck peak is detected as a unique peak about 44% of the time.
Of the “not yet reported peaks” there is the tiny peak (purple) between the N term peak and the glycosylation peak, and the three peaks just lateral to the glycosylation peak. The latter three peaks are as follows: one large peak (detected almost 100% of the time) which is about the same size as the glycosylation peak, and two smaller peaks (pink and white – matching the color of the rows of data). Circles are approximate representation of relative peak widths.
This leaves three additional, as yet NOT reported peaks, bringing the total number of peaks not yet reported to 5. The percent detection is given below in progressive sets of data.
The number of peaks (top row, number of peaks, number of trimers, and subpeaks (from 1 peak to 8 subpeaks, in columns) in each dataset is shown below (color markers for peaks remains consistent throughout (and also on previous and newer posts). The glycosylation peak (light green row of data) and the adjacent as yet unreported peak (darker green row of data) show consistent, multiple sub-peaks. These sub-peaks are found mainly by the signal processing functions. Addition of dodecamers to the initial dataset show little change.
