Surfactant protein D is listed in many websites, and even wikipedia, as just the carbohydrate recognition domain and neck domain, little else of the molecule (which includes the N and collagen-like-domain) has been modeled. This blog has many posts dedicated to understanding why the other two domains have not been modeled.
Wonderful images found in Arroyo, et al, offer a great opportunity to look critically at the structure and it is clear that there is much information available from a deeper look at those AFM images. That was the initial purpose of this blog, however, it became clear that just plotting the grayscale along a line drawn through the images of the dodecamer arms (hexamers) of SP-D some serious processing of the images was required. So I set out to find the “best” that best enhanced the images without changing their data. It also became clear that an unbiased count of the grayscale peaks along the plots of hexamers and trimers) was required. Then numerous signal processing programs were used to find the “best” algorithms for counting peaks. This, along with image processing ARE still subject to the bias of the investigator.
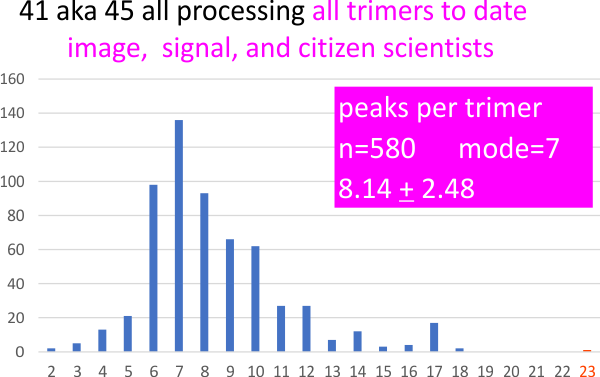
The parameters for both image and signal processing are driven by the opinion of the investigator, and then I though perhaps some citizen scientists (friends and family) could be asked to count peaks in the grayscale plots to compare to plots from image and signal processing. The bar graph shows over 500 individual attempts to find the number of peaks in a trimer from a single image of SP-D. Images below that show the actual image, and an example of one such plot and graph that summary bar graph.
Mean peaks per trimer = 8.14 +/- 2.48 , but the mode is 7, shown below. The mode is 7 likely because when counting the peaks the N term gets counted for each trimer, but is usually seen as one central bright(est) high(est) peak.
White arrow on the image of SP-D shows that the entire N term plus the trimer arm is plotted toward the CRD domain. Known peaks are N, gly, and CRD, the other four peaks are consistent and will be meaningful at some point. The peak at the neck is sometimes seen, often depending on whether one of the CRD of the trimer is lying overtop.
Just from my own observations, there will emerge an additional, very low and narrow peak just at the bottom valley of the N termini peak. Not shown here, but barely detectable on the line plot (but not marked with a color in the lower bar graph) between N and gly.