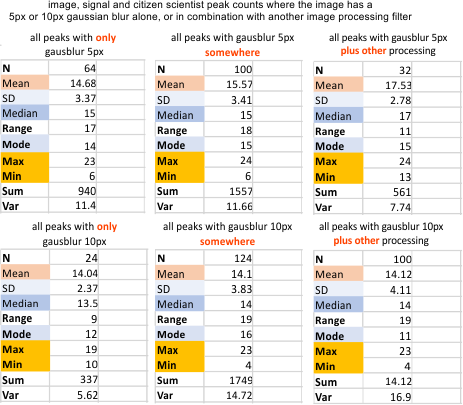
5 and 10 px gaussian blur filters have little impact on peak counts of SP-D hexamers, as it seems from a summary peak counts (see image below).
Much of the peak count data collected for single dodecamer of surfactant protein D (as a grayscale plot with peaks along a line drawn through the center of each of the two hexamers, CRD to CRD)(my molecule number – 41_aka_47) was performed on images that had been subjected to a 5px or 10px gaussian blur. The blur application using the programs listed in previous posts did not specify the px radius of the blur, except one (a filter in Photoshop 2021) that called this blur 10px radius. This plot was included with all other gaussian blur filters. Only one image was processed with what i presume to be a gaussian blur (Octave blur 101-10).
Of the total 159 sets of plots, 7 images received NO processing, 62 received a 5px gaussian blur, 50 with a 10px gaussian blur. Almost always the lowest pixel blur to barely smooth the image was employed. Gaussian blurs were used before other image and signal processing to eliminate low res pixellation in the original images (saved from pdf files). High levels of blur are not in the best interest of preserving detail, and the amount of blur was always dependent on the quality of the original (access to the original digital files, presumably higher resolution images was not possible).
Below is a summary of the impact of gaussian blur on peak counts. Gaussian blur (either 5px or 10px) alone, or with some additional image processing, or the whole set together. The mean peaks counted in each the hexamers 15.0+/-1.24 (nothing really different from what the entire set of plots predicted (see pervious post).
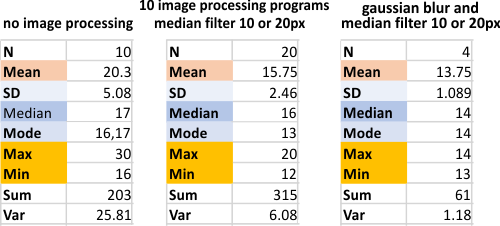
 It would appear that the removal of pixellation using minimal processing (in this case just a modest gaussian blur, or a median filter, does reduce the number of grayscale peaks in each hexamer. The highest number of peaks per hexamer is in the “no image processing” group. The effects of processing were easy to see directly from the plots, but required a more unbiased verification. Please dont confuse the titles of the summar data eg “mean filter” “median filter” “maximum” “minimum” “box blur” (WHICH APPLY TO THE “FILTERS APPLIED” with the vertical data which calls the calculated data by similar names “mean number of peaks”, Median, Mode, Max (as in the maximum number of peaks counted in a dataset of a plot) Min, Sum, and Var (variation). Totally different things…. same names.

Limit range filter (Gwyddion) was the filter that I liked best, especially when used with a gaussian blur. There is only one image on the graph below, but there are dozens using this filter under the signal processing group. There is a pretty obvious increase in peaks with this filter.

Maximum, minimum, mean and box filters applied to this image, sometimes with gaussian blur as well. Perhaps the minimum and box filters increased number of peaks found, but I would not personally use these filters to enhance peak detection. It was reasonably evident from the image after application of the minimum, mean and box filters that the result was not what I was looking for. 
Lowpass, unsharp mask, and smart blur. (All counts from image processing)
 Just using the bitmap filters and masks of CorelDRAW and CorelPhotoPaint, Photoshop, Gwyddion, ImageJ, Paint.net, Inkscape, Octave (just for image processing no signal processing here), and GIMP show the following summaries. (All peak counts from each of the image processing programs — each analylzed separately to see whether there was variation in the algorighms used.)
and the value I see as putting the image processing into a category of “nice” not too specific. There is so little variation between programs that “opinion” and “ease of use” and type of “output” would seem to be the best criteria for which to use in microcopy. I have a preference for the proprietary programs, just for ease of use (except ImageJ which is really a great program) and Gwyddion, though the only use i found was for image processing, and i also found the plotting function produced lots of errors (in my hands). But Gwyddion does have a great function for limiting range and I used that often. It seems that with image processing, 15 peaks per hexamer is going to be the very best result, consistent and easy to verify. Abbreviations are listed in a different blog (here). 


