Lots of measurements, maybe this will allow me to pick and choose which processing provides what I think is the best overall measurement of the N termini junction peak for SP-D. This includes image processing (dozens of programs and filters and masks done separately) signal processing (several algorithms from libraries used by Octave, Scipy, some excel templates and others) and a section of citizen scientists who pointed out peak number and position.

The tiny peaks on either side of the N termini junction are elusive, and dont show up all the time. Fact is that I see them frequently but only record their widths and peaks if the signal processing programs detect them. It is likely that I pick them out when signal processing only does so occasionally As for citizen scientists (1/52 plots) does not. Therefore a comparison of that image processing vs the signal processing data will be quite different. 165/632 trimer tracings (38%) showed a tiny peak (38%). The image processing was best at detecting those small peaks on either side of the tall N termini junction peak (detected 133 times out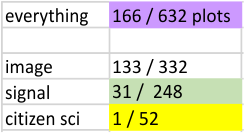 of the 332 plots made with images processed in various manners. Citizen scientists just did seem to see it. The mean nm for that peak (actually those peaks, tiny, and at the valley on either side of the N termini junction peak) is shown to have a peak width (this is measured valley to valley) of 3.55nm.
