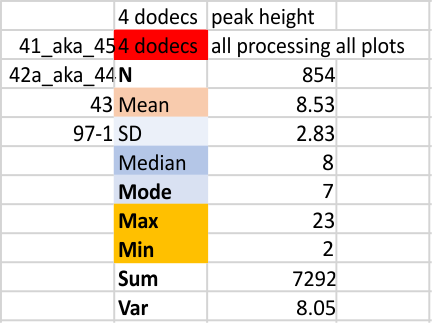
Previously counted plots included all that were available at the time (found in this link; which had about equal numbers of plots from each dodecamer (hexamer – trimer). The data on this page show just about every plot that I have ever made….. these are divided as to trimer…. so this is mean trimer peak number. The latter counts the N term peak with each trimer (even though it is shared between all the trimers…. each trimer it gets counted once. Therefore a peak number of 8 per trimer would become peak number of 15 per hexamer owing to the N term peak being shared. In terms of progress…. its best to assume that the more recent posts are the better data. Every possible image and signal processing filters and algorithms are summed here. Some people counts, all counts…. this represents a huge N, in my estimation.
I think my current favorite image processing filter is still the gaussian blur, and my favorite peak counting program is PeakValleyDetectionTemplate.xlsx by Thomas O’Haver.
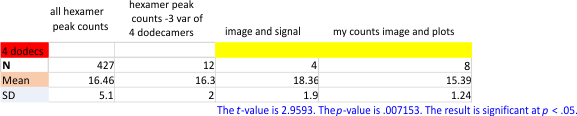
Peaks per hexamer were calculated four ways. As every plot made for each of these four dodecamers. This includes hundreds of counts for one dodecamer, and between 26 and 50 hexamer plots for the other three. Certainly one carries more weight, or one would think, but the data using each of the plots separately is not different than using each of the methodologies (at an absolute minimum there were 2 image processing filters, and at least 5 signal processing algorithms for several of these image processed pictures.
Data are also given with each of the four dodecamers individually: (41_ak45; 42a_aka_44; 43; 97-1). In addition. n, mean, sd, and other parameters were calculated from my original peak counts from just the “image”, as well as from my original peak counts from the plot generated in ImageJ. This is in addition to the whole lot of plots subjected to signal processing. Bottom line is that signal processing appears to increase the peak count in a significant way. Whether the signal processing is “better” (which i dont think it true” or counts from images is “better” remains to be sorted out. Below is a comparison of the various “sorting” that I used to determine mean number of peaks per hexamer of SP-D.
Two left columns are: 1) Every plot of a hexamer separately, 2) Plots divided into each of the four dodecamers separated into groups; Two right columns are counts separated into “image with signal processing” per dodecamer ( and separated again into, my counts of image processing plots only plus my counts of the peaks in plots made in ImageJ (that is… NO SIGNAL processing) 18+ peaks with signal processed plots, and 15+ peaks using my hand counts. 15 peaks per hexamer is in my bet for the best number. See previous posts here.
Comparing just the means of the four dodecamers I have plotted many times, there is still a large difference found between those images processed with a limit range by Gwyddion, and all others (lumped) processed by many many different image programs and filters. Someone else can investigate and suggest) whether this set of filters should be included anyhow. How many times the plots of images using gwyddion’s (or any) limit range filters should be included in the dataset or excluded…any choice I make will be arbitrary – and the change in the way ImageJ plots maybe inherent in the app… and not for me to figure out. Peak height in all Gwyddion processed images vs all other is shown below. 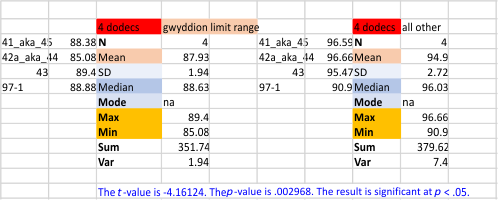
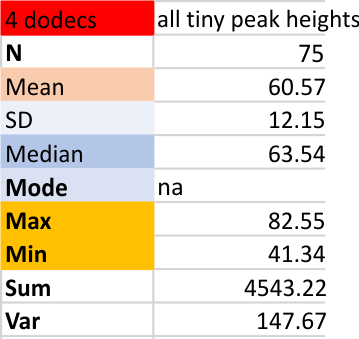
The smallest peak that I see, which is on the downslope of the largest peak (N termini junction peak in the center of the dodecamer) and is very often missed by the signal processing algorithms… thus not all signal processing programs identify all the time (75 times out of 200 plots). the “tiny peak (one occurs on both sides of the N termini peak) has a height “relative to the N term” shown below. The value of 60 is percent of 100 percent, where 1-100pc = 0-255 grayscale units. This small bright area along the arm of the molecule is NOT seen on all four arms of the dodecamer consistently, but it occurs at a frequency that made me take notice, and that i can identify often enough to consider it something to investigate. Summary below is taken from four dodecamers (16 trimers, 8 hexamers, four molecules) of SP-D. The signal processing here has been done on images to which a limit range filter was applied in Gwyddion and the four SP-D molecules were not separated, the N of 75 represents just those where signal processing found peaks out of 200 plots.