Below are the numbers for peak width for the glycosylation peak. The characteristics of peak, that is whether it is a single simple peak or a peak with multiple elements, I dont find good mention of in the literature.
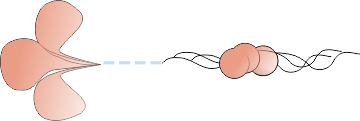
It is worth noting that because there presumably are three sites (one per strand of the trimer) which are potentially glycosylated, and whether there could be a bumpiness to the bright areas in an image representing the glycosylation peak. This might reflect structural features of “image” the three single strands if they are or are not glycosylated while wound in to a trimer thus causing a displacement of glycosylation sites perhaps showing up as peaks within the glycosylation peak (envision three beads on three separate cords, wound tightly, each displaced slightly creating a lumpy look. This is completely different than the images which show the large CRD and neck elements which do show large bright areas quite distinctly separated at either end of the hexamer. see CRD peak appearance with AFM images, left, and possible completely glycosylated trimer on right (NOT TO SIZE).
In most micrographs there is a dominant “bright” region which has been identified as the glycosylation peak in numerous publications, including the one by Arryoy et al which i rely upon heavily) as a single peak. Close visual examination reveals a couple of things, 1) it is a peak of varying width, and 2) sometimes it is possible to see small sub peaks within the whole. Signal processing and peak counts from images before and/or with the application of image filters, it is common to see bright spots within what might be considered a single larger bright region (brightness in this context is higher on the gray scale value y axis than lower). Defining the “modest but colvincing ” number for peaks along a trimer has been the focus of this research. Both total relative peak heights and valley to valley widths (not taking into account slope or mid peak areas) have yet to be determined for a hexamer of SP-D.
So using just a half dozen analysis protocols on FOUR (4) SP-D dodecamers (16 trimers – where the entire N term peak is included in each trimer), the first three peaks (beginning at the whole N termini junction peak) looks like this. N=19.86nm+1.46, tiny peak=2.53+0.74, glycosylation peak width=8.4+0.69.
My tendency was/is to see the AFM images of this molecule as having 15 peaks. Two pominent CRD peaks at either end of the hexamer, one peak (possibly with its own central valley (so moving the odd number of peaks to an even 16) in the middle and two recognized peaks either side of the N term. These peaks are numbered in many of these blog posts as Peak 1=N term, two tiny peaks on either side of 1, mirrored as peaks=2, then the two glycosylation peaks =3 (either side and lateral to the tiny peaks and sometimes clustered peaks. Peaks which follow I am now suggesting are “real events along the collagen like domain” as peak 4, moderate size, fairly wide peaks, next very narrow low peaks=5, broad low peaks=6, and sometimes visible peak which appears to be the coiled coiled neck domain where sometimes it is covered by the CRD, sometimes not=7, at the end, the CRD peaks which are very prominent sometimes exhitibing clustered peaks=8. These I have colored with specific colors through out the peak counting process, as my own assessment of which of these categories the signal processing peak programs miss the mark (which sometimes they do, sometimes they dont).
Not all trimers show all peaks, thus the attempt to find a mean width, peak height and humber amont the dozens of AFM images I have collected.
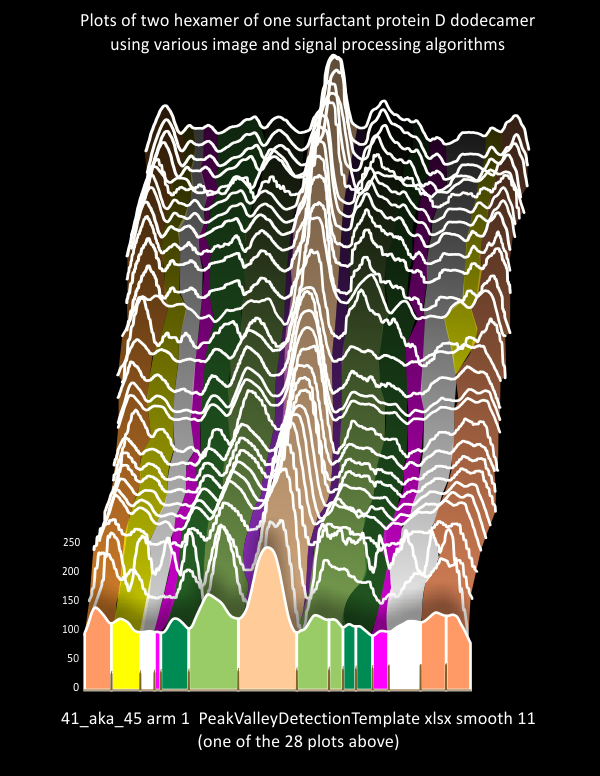
Here is a link to description of the ridge plot (Joy plot) shown below.