Dilemma: How to use the grayscale plots of SP-D hexamers obtained in ImageJ from images exported from Gwyddion (as red only) in the same datasets as imageJ plots of SP-D hexamers obtained from tiff files exported as RGB. ??? I have left out of my peak height and valley analysis all those plots from Gwyddion because i did not know how to use them. They have very low grayscale peak points and can’t be used along with those which have a highest peak grayscale value (RGB) of around 250. The peaks at about 90 (0-255) and peaks at about 250 for both types of plots just dont work together and I hate to ignore the plots from Gwyddion (as they have a good “limit range and gaussian blur” filters).
To see if I could safely adjust the plots required figuring out, in ImageJ, how to save a segmented line drawn in an image saved in R only, and recall it, and use it on an identical image saved in RGB. So I did this, and while the two plots are not totall “identical” as i moved one node at the right end, they are almost identical. Each grayscale line plotted in imageJ for the R and RGB image was saved to excel. (i wish i could figure out how to create a standard plot template in excel, because even if i choose 0 to 255 scale in ImageJ, excel does what it wants with the y axis and i have to rescale it.)
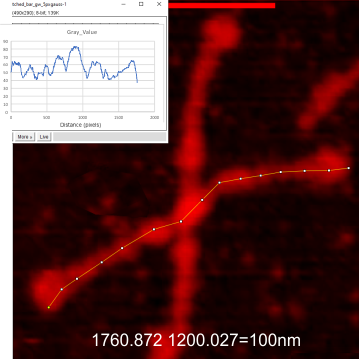
Below are images of the identical SP-D image (named 127 aka supplement 4A) exported from Gwyddion (gw) as a red tiff, and plotted, and changed to indexd RGB in imageJ, and plotted again using the same segmented plot line restored. Both plots were saved, and opened in excel and a chart was created. Those two plots were saved as metafiles and pasted into corel draw, ungrouped and the line from the R only plot was scaled (without rescaling the x axis) to the same height as the plot from the RGB image and then moved to bottom right of the RGB plot.
As you can there is no difference between the R and RGB plots. So this means to me, that i can take my gw plots and scale them on the y axis and use them in my dataset with the RGB plots. Any issues that i am missing that say “dont do this”?
Top two images are the images with segmented plot lines created (and saved) in imageJ. Bottom image is the two plots, and the lower plot scaled to the y axis (only) and pasted into the RGB plot. — so the difference in grayscale peaks can be scaled using a formula.

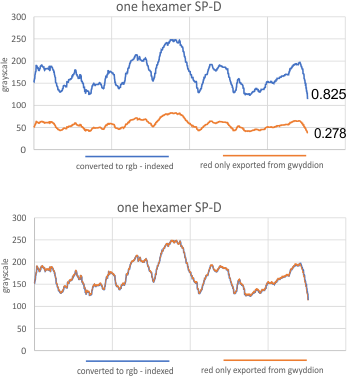
Indeed it would be almost laughable if it just requires a 300pc increase, i would need to find the grayscale value for the highest peak of each image i think inorder to align the R plot to a value.
Thanks to my kids…. dan and aaron. Dan was right in seeing that the grayscale R image max grayscale value was 85. i will use a factor of 3 when analyzing the other gw plots to find a grayscale comperable to the RGB plots.