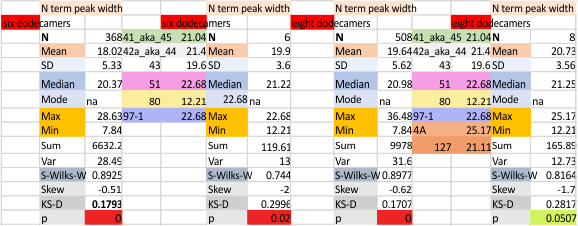
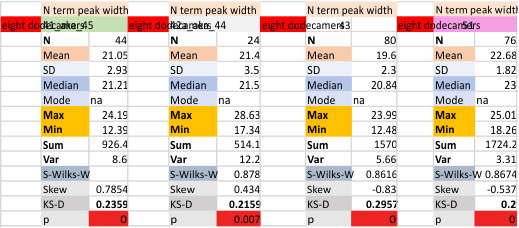
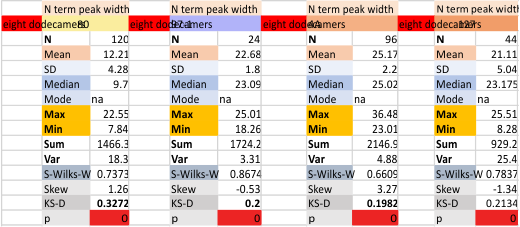
In this assessment of N term peak width, two new sets of measurements have been added. The caveat here is that both the image I have labeled 4A (supplement figure 4, image A from Arroyo et al) is also the image that I have named 127 (from the body of the paper, thus a different resolution, different bar marker, different ppi, and different contrast and HSL, image processing filters, (but NOT different peak finding apps). These are sort of used to compare differences between random image factors (you can make your own comparison just by looking at the statistics for 4A and 127 in the figures below). A two-tailed t-test determines: The t-value is 6.57159. The p-value is < .00001. The result is significant at p < .05 between the two sets of data. They are not out of line with means for N term width for other N termini peaks.
Means for the N termini peak of n=six dodecamers, and n=8 dodecamers is the top figure. And individual dodecamers are listed in the two figures below (by the names I have given them, and also color coded).


