A summary of peaks and valleys of grayscale plots of 12 dodecamers of SP-D is found below. They represent peak height, valley, widths plotted in ImageJ, from published AFM images of the molecule. These three data points were found for each trimer of the dodecamer using peak finding functions from Octave (Autofindpeaks-xy, ipeakM60) and from Python/Scipy, Stack Exchange, ImageJ (local maxima), an excel template (PeakValleyDetectionTemplate.xlsx) and analyzed from plots from dozens of image processing filters in at least 6 image processing programs (CorelDRAW, Photoshop, GIMP, Photopaint, ImageJ and others).
These charts include “all” data, not sorted by functions or filters.
Currently there are THREE (only) reported peaks in a trimer of SP-D, this would seem to be a significant underrepresentation of the number of peaks actually contributing to the structure. Incidence of N terminal peak (light orange), glycosylation peak (light green) and the as yet un-named peak lateral to the glycosylation peak (dark green), and the CRD (carbohydrate recognition domain ) peak (orange) are present 100X of the time. The peak proximate to the CRD peak (coiled coil neck domain) (yellow) is present infrequently, but is detected in sufficient numbers to add it to the list. The tiny peak (purple) on the downslope of the N termini peak is present infrequently, but is detected in many dodecamer images. Two additional peaks have specific character as well, a small thin peak (pink) and a broad low peak before the neck peak (white) are consistent, but not detected 100% of the time.


 The mean number of peaks using all the counting apps and functions including those counted by me from the original plots, is around 15. Whether the hexamer has an odd number of peaks (with a possible two portions to the N termini peaks) or an even number of peaks (with the N termini peak being center, and also occurring once) is not determined. There are images which show both occurring.
This is an image of SP-D retrieved from a published article (see ref on image), showing how each of the hexamer-arms were traced, and how a diameter of the molecule was traced (touching three of the four trimeric CRD domains). This particular molecule has been shown countless times on this blog. Hexamers were “always” traced from left to right, and labeled separately as 1a, 1b, 2a, 2b (each trimer recorded separately) and replicate tracings for signal processing function plots and image filter plots were traced in an identical manner. In this particular image the original figure had an identifying letter which was patched and that line is visible in the image below, but did NOT impact the tracings of the image of the dodecamer itself. Green bar=100nm which was derived from the original figure.

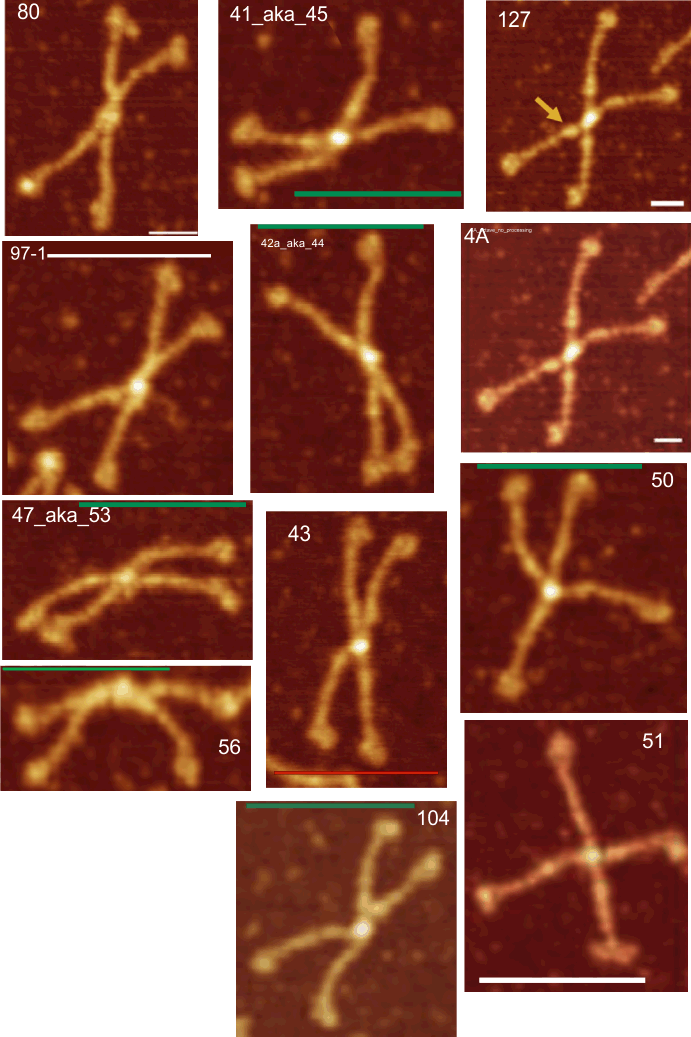
Images of the 12 dodecamers used in this analysis are shown here.