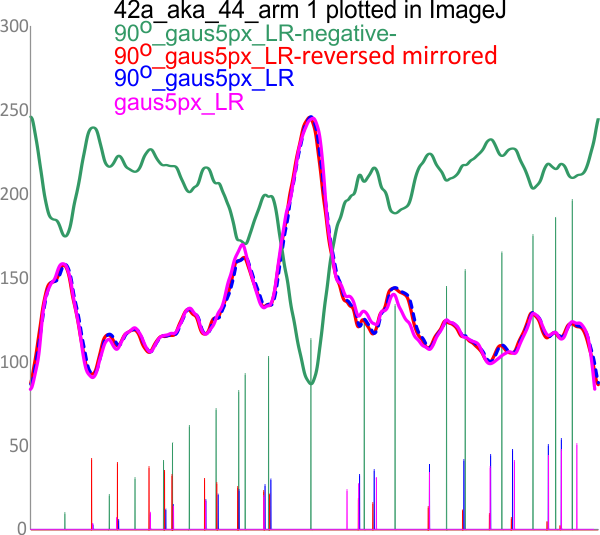
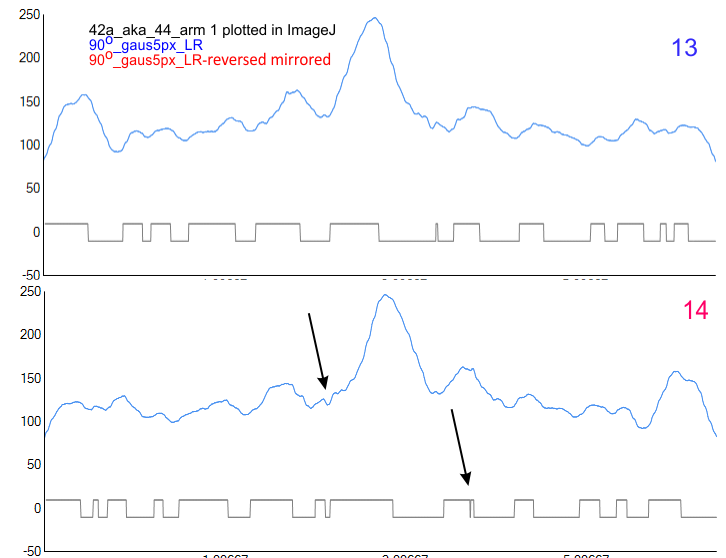
LR plot of an AFM image of SP-D (taken from a publication of Arroyo, et al, 2018), and the reverse plot, and inverse plot – were compared using a PeakandValleyDetectionTemplate.xlsx – no variation in valley and peak detection found using a left to right plot, reversed direction (using excel) plot, and inverse plot (also using excel) did not show up differences in how the number of peaks and valleys were detected using the smooth 11 setting. I am doing this for two octave functions, as well as LTI peak finding, and a scipy function. I am just trying to see whether the tallest (and small preceding and following) peaks are detected without bias, as well as i think they are in this program (found online). Plot images and valley markers were mirrored, peaks found in the inverted plot matched peaks. My thoughts that peak height affected peak detection in some programs appears NOT to be the case here. In addition, the image was rotated before plotting (noted in image) to see whether a top to trace was plotted differently (as was found with gwyddion). Greater difference is found with a “new” tracing (plot) than with reversing direction of the xlsx peak and valley detection (pink line).
Image J seems to trace segmented lines top to bottom and rotated images similarly.
 Using Python scipy peak finder, prominence 0.2, distance 30, width 5, threshold 0, height 0, in the same LR plot and reversed plot, the same peak points and peak number were found.
 Using a peak detection script from stack overflow there was a small difference when using the parameters Lag, Threshold, Influcned on the forward and reversed plots.
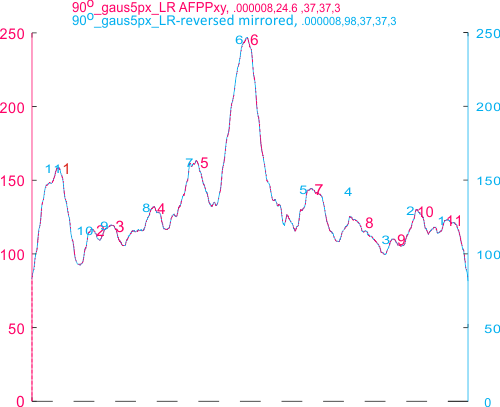
autofindpeaksplot(x,y) (in Octave; different values for LR and LR-reversed arm 1 of the SP-D dodeamer, shown below) are generated automatically? Plot number and peak ID are identical whether for LR or LR- reversed. Please note that i have mirrorred the reversed plot image over top of the left-right line plot that was derived in ImageJ, just to show they match. Peak number is calculated LR (red), and LR reversed is blue.
Using ipeakM80 for octave, initial tracing L-R had 18 peaks, but the 90 degree rotation tracings (both LR and reversed) had 20 peaks. So again the biggest difference is the actual segmented line drawn into ImageJ. Bottom graph (ipeakM80, same graph as the one just below this text just has had the text removed. So it appears that each of the programs used here detect the same number of peaks when reversed, and no significant bias occurrs due to direction the plot is read.


