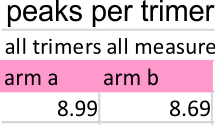
The result from the data of peak numbers, per trimer (two trimers per hexamer (which i labeled a and b), and using all image filters and signal processing peak finding apps for 448 trimers each, for arm a and arm b, there was NO significant difference in number of peaks found one from one side (a) to the other side (b). The t-value is 1.2919, the p-value is .196725 at p < .05.
I used the socscistatistics.com website’s 2-tailed t-test calculator (see graphic below). So just over 8 peaks per trimer (please note that the N term is counted as one whole peak, not divided into “half” as might be expected due to the shared peak of arm a and arm b in each hexamer (or multimer with many trimers). [ALL trimers, ALL measures] image below shows average number of peaks. Arm a is “always” on the left side of the image, and arm b is “always” on the right side of the image. Arm a is also the highest trimer on the left, and arm b is the lower trimer on the image (see diagram at bottom).
The dodecamers expectedly fall randomly on the mica surface during preparation and are scanned in a fixed manner by the probe, and assumed to represent unbased events. The lines measuring grayscale in each molecule are drawn the length of each hexamer (CRD to CRD) through the center-width, and can be at any angle from left to right, as well as curve, or bend. This is assumed to be random. A segmented line was used in ImageJ to accommodate this variability.
 I tested whether the same dimensions were recorded when tracing through a hexamer with ImageJ by rotating the image at various angle, but plot measurements were consistent regardless of how the image was oriented. That said, I also tested plots in Gwyddion and was not successful at creating an unbiased plots when tracings were vertical or lengthy. ImageJ was reliable and easy to use, so all plots were created with that program.
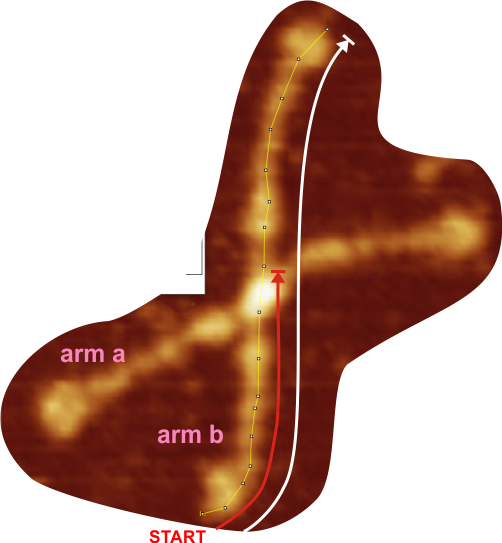
Example below is a tracing for a hexamer, the direction of the trace, start-point, and portion of the trace ascribed to the trimer, and hexamer are highlighted. Light line with nodes show the original trace in ImageJ, white arrow shows direction and inclusion area for a hexamer trace (CRD to CRD) and the red line shows the area included in the calculation of peaks per trimer (which is different than peaks per hexamer, since in that case the N term peak is only counted once per hexamer).