Surfactant protein D (SP-D) is necessary for lung surfactant structure, but also a critical for immune protection of the lung and other tissues (doi: 10.3389/fmed.2018.00018). It is a high molecular weight hydrophilic protein found as trimers but also present as multimers of 30 or more trimers, but dodecamers are the multimer analyzed in this study, suggested to be important for innate immune defense.
The purpose of this study was to find 1) appropriate unbiased methods to determine how many peaks (grayscale) appeared along a segmented centered line drawn from CRD to CRD in a hexamer of SP-D in order to 2) help define the molecular structure of the SP-D hexamer and dodecamer, 2) to identify which peak (brightness, grayscale 0-255) along that trace might be important for binding with….. 3)and to begin a discussion on whether signal processing peak finding functions are helpful in unbiased assessment of topical variation in AFM images while identifying peaks along a plot of any molecule, and SP-D in particular.
Abbreviations: SP-D, surfactant protein D; N-term, N terminal domain and collective junction in the center of the radially organized multimers of SP-D; GLY, glycosylation site of the SP-D trimer; CRD, carbohydrate recognition domain; C-d, collaen-like domain; NECK, coiled coil domain; AFM, atomic force microscopy;
Inspiration for finding out what SP-D dodecamers really “look” like came from the vast array of diagrams of SP-D in the literature which compared to actual microscopic images. Some of these diagrams were just erroneous, and when querried, one author excused his diagram as “artistic license”. There is no room for artistic license in factual representation of data. In addition, others use misguidedly use images in their publications showing just two of the four domains of SP-D without expressly mentioning that this is NOT the entire molecule, but just the coiled coil neck and carbohydrate recognition domains. This matters because consensus suggests there are 4 domains in a monomer of SP-D: a short N terminal domain, a long collagen-like-domain, coiled coil neck domain, and a C-type lectin domain (carbohydrate recognition domain)(CRD), configured as homotrimers with the neck domain thought to be responsible for the coiling of the CRD and collagen-like-domains into trimers. (Ping Li, 2009);doi:10.1074/jbc.m600651200;DOI: 10.1016/j.molimm.2009.06.005). Neck and CRD domains have been modeled often, and flexibility between neck and CRD has been suggested, and is clearly visible in AFM images.
The collagen-like-domain of SP-D is not required for multimer assembly, nor for some of the innate immune functions related viral pathogens has not yet been modeled ( ). It was noted by Kingma et al that it is, however, required for some aspects of macrophage activation and surfactant function (doi:10.1074/jbc.m600651200). Others have investigated edited molecules and examined function, these images are shadowed TEMs, and are not suited as well for peak counting as AFM images (refs).
A realistic diagram of SP-D should easily be possible since hundreds of actual images of the molecule are in the literature, and a large assortment exists of SP-D trimers, hexamers and multmers. The latter are mirrored, symmetrical structures with attachments at the N terminal domains (center) and CRD domains (ends). Negative staining, rotary shadowing and atomic force microscopy confirm that arrangement , and have provided evidence that dodecamers are a “common” form (PMID: 36330647 DOI: 10.2174/1389203724666221102111145;doi:10.1074/jbc.271.31.18912). The proportions of various oligomers differs with methods of preparation, disease, and species.
Negatively stained molecules were less than informative, shadowed images, even wonderfully shadowed images had a background that was almost too textured to make out tiny detail. AFM in particular, in a really wonderful presentation of SP-D images (Arroyo et al, 2018) was method that showed quite a bit of detail. In the latter publication, three peaks along the SP-D trimer were described: the N terminal domain peak, a glycosylation peak (present if the molecule was glycosylated) that occurs somewhere along the collagen-like domain, and the CRD peak at the C term.
Known peaks: The N term peak is a union of 6 N terminal domains and creates the tallest peak of the hexamer (12 in the dodecamer). It consistently has the greatest height and width of all the peaks in multimers. The collagen-like-domain is relatively straight portion of the molecule, but when it is glycosylated, a prominent peak occurs relatively close to the N termini peak, and often has sub-peaks within the overall framework of a single peak. The coiled coil neck region is not only the area with the lowest grayscale values (small peaks) but it is often visibly “covered” due to the floppy nature of the adjacent CRD peaks. The latter peak (CRD peaks) appear as “balls” tethered in a floppy manner to the rest of the molecule at the neck domain region.
It was easy to see in the AFM images of SP-D, that three peaks per trimer (5 per hexamer)(Arroyo et al 2018 doi:10.1016/j.jmb.2018.03.027) was a conservative count, and that other peaks were present in a consistent and mirrorred pattern.
NB, unbiased and biased, these are relative terms. And since the researcher chooses the paramaters of the image filter and signal processing functions, human bias is present. In addition, the specifics of the functions (lag, threshold, height, influence, moving average, smoothing) can be manipulated so extensively that signal processing functions may offer greater opportunity for bias than just counting the peaks from the image, or the grayscale plot of the molecule. Furthermore, biased may not be a bad thing, we learn from practice, watching indices change, from repetition, from seeing in and out of focus images, high and low resolution images, its called “learning”, or “training”, The “learned” bias is present under circumstances which involve both image filtering and signal processing. Peak finding functions do not seem to provide much benefit over a careful, educated visual assessment.
COMMENTS: “filtering out false positives? It sounds like the parameters used to determine what’s signal and what’s noise need to be tweaked to match what you already “know” to be the right count. I don’t know how you’d differentiate between you training the algorithm or you introducing bias, but at the very least you could determine what variable values in the algorithm correspond to what your brain is doing.”
COMMENT: agree, it’s filtering. filtering out noise. i believe there are sliding window methods for filtering or smoothing, but do not recommend arbitrarily creating N bins to put your data into
you could pre-filter or pre-smooth the higher noise frequencies out by some rule- but that should also have some justification. if you filter too much of the high frequncies out you’ll get too few peaks. there is going to be some sweet spot for pre-smoothing out noise but minimizing data loss
the noise floor in this data is artifacts from the AFM itself such as scan lines, and compression artifacts (rectangular jpeg artifacts) in the image causing variations in the gray values that are not in the actual molecule.
i would take a look at what assumptions you can safely make about the SPD molecule- what is the minimum size of an atom (amino acid groups, domains) you expect to see in that moleucule, for starters-you could assume there shouldn’t be any frequencies in your noise below 2x the size of the smallest atom (amino acid groups, domains) in the SPD molecule, for example, and maybe based on the molecules as well, if you explore how the AFM probe detects electric fields. there are assumptions you could make about the noise frequencies.
the noise floor is relatively high, but if you’re certain you can see something, then hopefully you can apply some consistent pre-filters to produce the desired outcome
if you filter the noise down iteratively until you get the most consistent peak *positions* then you should be able to optimize it without going too far and filtering out real peaks (yes i have tried this…. there is a way to eliminate peaks altogether, but also a broad area where peak number doesnt change that much, and then on to unrealistic peak numbers. There is that “sweet spot”.
however the idea that there are always going to be N peaks, or that the molecule is always going to be bilaterally symmetrical may simply be wrong. i would just go where the data leads you and stay open to that- you may discover something unexpected by remaining unbiased. if you’re convinced that your methods are producing the wrong result, then go back and change them
i would definitely leave out anything subjective like your visual acuity.
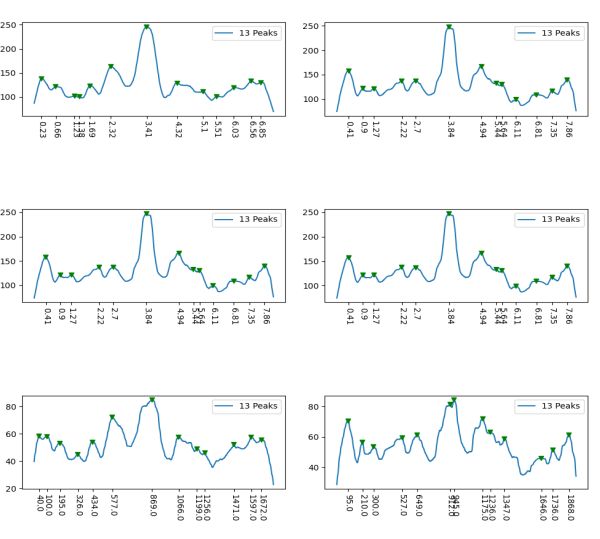
COMMENT: interestingly in almost 1000 plots, some my counts, some scipy, some octave, some LTI, some excel template — the was no significant difference in the number of peaks i counted from the image, and the number of peaks counted in that batch of algorighms. THere was a difference in how i counted the peaks from the plots, and the number of peaks counted the algorighms.
Little changes in peak counts in the sweet spot “scipy-find_peaks_p0_d30_w5_t-null_h-null”
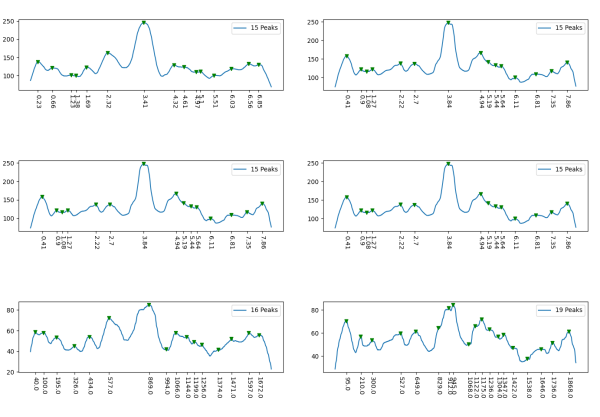
scipy-find_peaks_p0.7_d30_w10_t-null_h-null