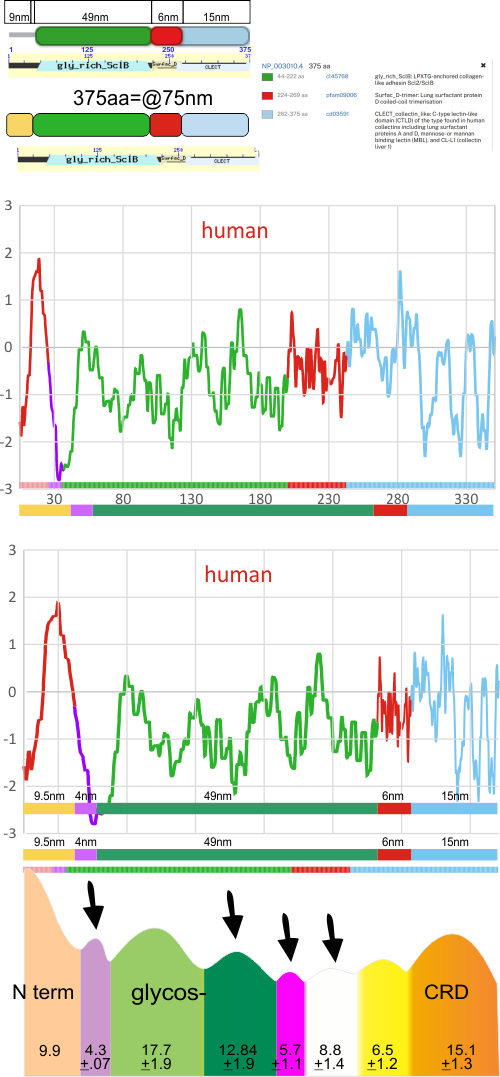
The hydrophilicity plot(s) for SP-D from 5 species (human, macaque, mouse, rat, bovine) were found using NCBI aa sequences (whoe protein and regions) and an app from NovoPro. (The plots for SP-D were so similar I in terms of the values along the collagen-like domain that it seemed unnecessary to do more – find these plots HERE). They are shown below, each with the species name and the number of aa is on the x axis. The peak widths that have been plotted for SP-D in previous posts are shown, as well as the “half” N term width. The number of aa per domain does not correlate with the number of nm for the peaks, particularly for the folded CRD vs the linear collagen-like-doman. In addition, because of the “hinge” like link between the coiled coil neck domain and the CRD domain, the CRD portions of the molecule can lie back covering a lot of (if not all of) the neck domain, resulting in non-detection of the neck peak in over half the plots.
Using the length (in nm) of a trimer determined by many many plots, 73nm is the trimer length that I will use.
This works out really well in my opinion, except for the fact that on SFTPD orthologs – NCBI there is a small string of aa that are not part of N and not part of the collagen-like domain, and it fits nicely with a tiny peak found at the valley of the N term peak just before the glycosylation peak. Graphic below. Top plot by aa only, bottom plot shown adjusted for now many nm the peak actually shows on AFM images. Black arrows point to peaks which consistently appear in grayscale plots, which have not yet really been published. Peaks without arrows have been described.
