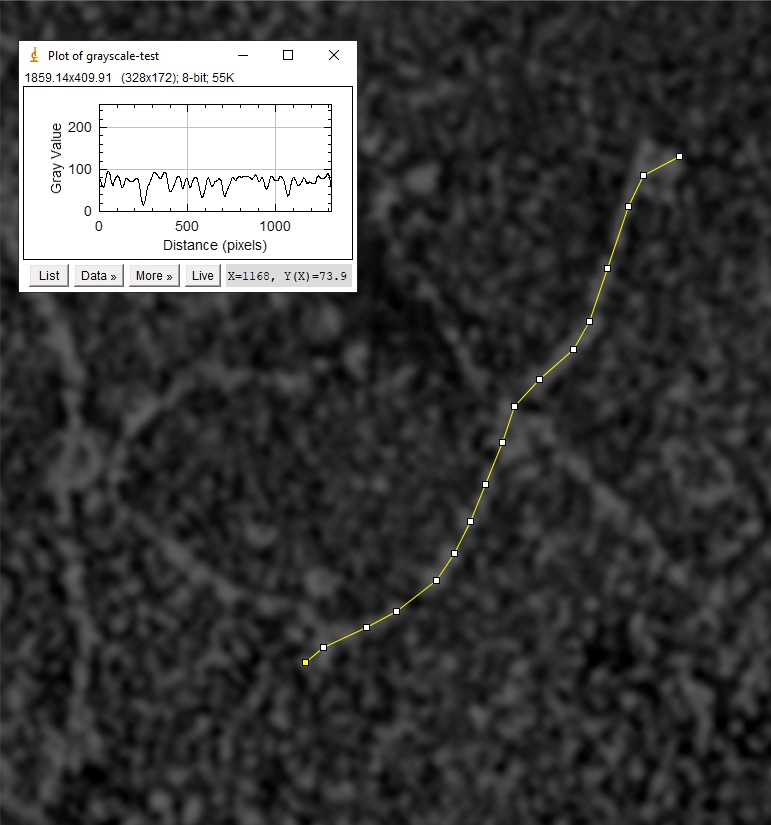
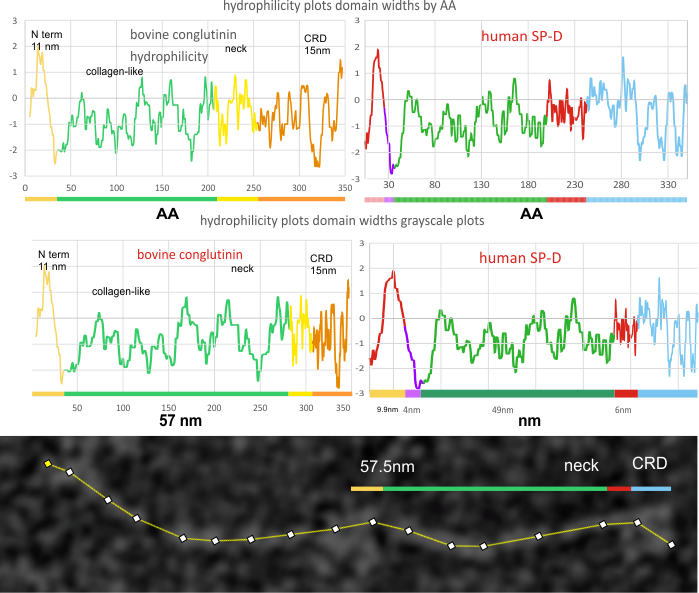
 SP-D and bovine conglutinin hydrophilicity plots by AA and by nm. Published images of bovine conglutinin (Strang et al, ) were subjected to gaussian blur then used to plot where the N and the CRD domains were found. His measurements didn’t include the neck regions and it seemed pretty clear that there was such a peak visible in his images.
Human SP-D hydrophilicity plots (made with the same app by NovoPro where hydrophobic AA are causing the “peaks themselves so better named a hydrophobicity plot), and bovine coglutinin were compared both by the AA sequence and nm dimensions. Strangs images of negatively stained molecules he considered slightly less in length than shadowed images, he did not have AFM images and the my plot comparison is with SP-D is AFM.
Hydrophilicity plot of conglutinin show a different number of peaks along the collagen-like domain…. but still the plot maintains a great similarity to the SP-D. A previous post (here) does plot bovine SP-D in comparison to human SP-D, as well as three other species. These plots are by AA, and I will adjust them to nm plots next. Image below is a crop of the image above and rotated to horizontal. The nm bar does not exist on Strangs images therefore I have estimated this from his description.
Purpose: to determine whether the hydrophilicity plots have been, will be helpful in discerning structure and function of surfactant protein D. Looks like conglutin matches up pretty much. So I am inclined to give them nm values that are predicted by SP-D.
It is possible that a larger CRD region is actually present (as i would have predicted from Strangs image, however i used his dimensions to create the color version above, and the hydrophilicity-by-nm plot just above that.
One interesting point is that Strang mentions different dimensions when using different TEM techniques — and it seems from his imags and comparisons with the CRD region in AFM images that the AFM blends the three CRD regions into a bigger “glob” than the negative staining and shadowing. This may be the reason that the CRD in is smaller than found in the SP-D AFM images. The way to find out of course is to have the each molecule treated in the exact same way.
Just another note, it looks like the N term junction of the shadowed image might actually show structure not seen routinely in AFM images.
Purpose here: to see whether the collagen-like domain, which has much similarity to the SP-D collagen like domain, has the regular “peaks” along its length like SP-D.

