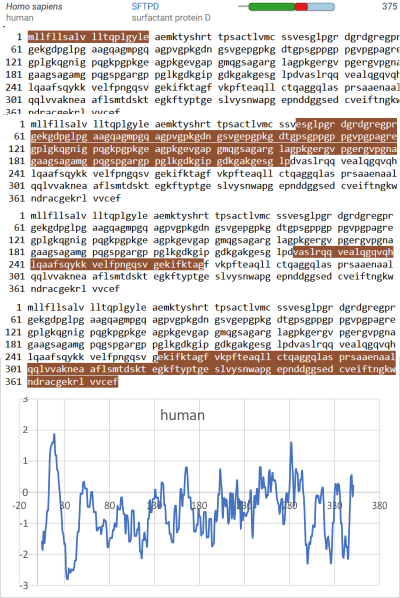
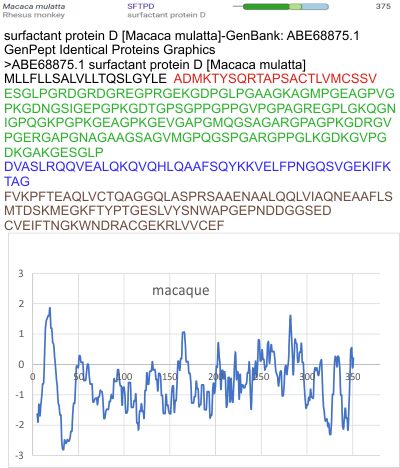
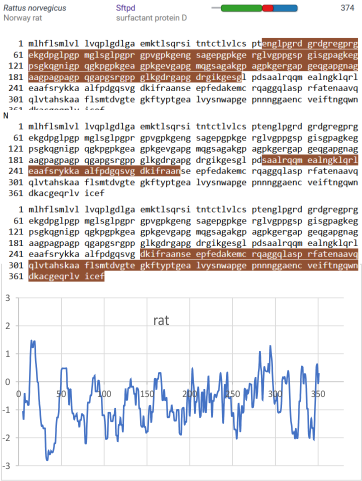
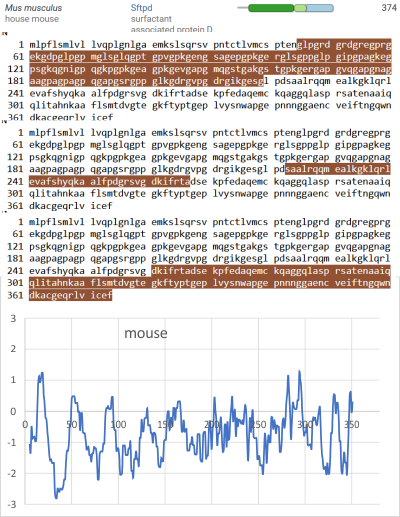
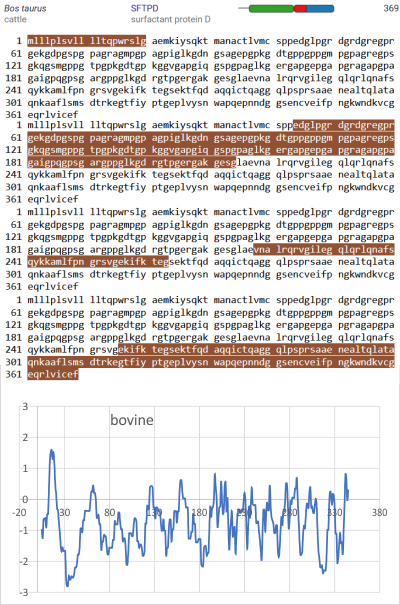
Hydrophilicity (hydrophobicity) plots of SP-D of five species (human, macaque, rat, mouse, and bovine) are convincingly similar to each other (as are their sequence comparisons) to confirm that a pattern was present in the hydrophilicity of some areas of the collagen-like domain. This led me to see whether the as yet unpublished 4 additional grayscale peaks in an SP-D trimer (1 distal to the N term peak, three proximal to the collagen-like domain (plotted in a direction with N term peak on the left) were “in line” with the peaks in the hydrophilicity plots. Known grayscale peaks for SP-D are — N term, glycosylation peak, CRD peaks — identified in published AFM images (Arroyo et al, 2018) there are additional peaks consistently found.
Species hydrophilicity plots of SP-D are below (plots are by AA, and not by folding (see tiny green-red-bar for folding) and a comparison of human hydrophilicity plots, and grayscale plots from AFM Images just for human is HERE.