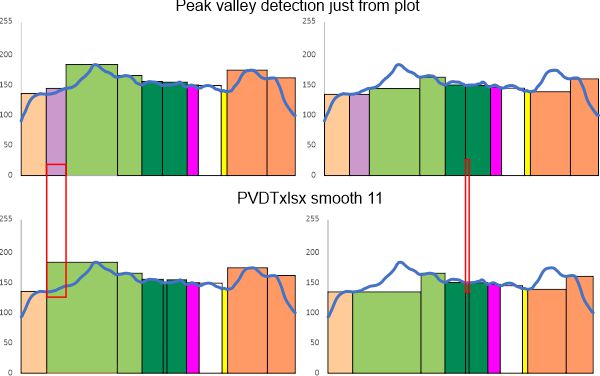
There are many things i dont understand about peak and valley detection using functions.
I would have to test out whether the lag and amplitude and influence of the detection works against having a tiny peak detected next to a high peak by plotting this same trimer of surfactant protein D up, down, rotated and mirrorred to figure out how to have it see what I see: that would be to include a tiny peak before the glycosylation peak, and eliminate a much less obvious peak in the middle of the series of peaks that follow the glycosylation peak. I know these things can be selected and I can choose whether to change the parameters. I am trying to eliminate not induce bias. I like the first lines by this blogger, yes i agree, the human mind is very unique.
This is a real handicap to detection of relevant grayscale peaks in a plot of the length of SP-D trimers. I could of course change the smoothing and other factors but then I end up with a rediculous number of peaks and it no longer is relevant.
Case in point… plots from ImageJ that I selected peaks on (which are in line with the vast number of plots from which a mean number of peaks along each trimer was established. (peaks on the left, valleys on the right, top row of plots) versus what i find with smooth 11 using (what i think is one of the best peak and valley finding templates around (easy to use, output can be edited like any excel plot as opposed to those that come out of octave functions for finding peaks which are, as vector illustrations, total nighmares to work with). The bottom set is what I get from PeakValleyDetectionTemplate.xlsx offered by Tom O’Haver – thank you). The trimer plotted is from an image by Raquel Arroyo et al – thank you).
The plots are virtually identical in peak number, width, height and valley EXCEPT for the two tiny peaks, one lost and one added.
