Varying the trace, may change the number of peaks, and whether this is relevant or whether sheer number of plots of peaks (grayscale 0-255) along a trace of a surfactant protein D trimer (or hexamer) negates these small differences.
There are many ways for peak numbers to change, 1) noted above, the way the segmented line is traced in the AFM images of SP-D, 2) the image processing filters, enhancing or reducing peak brightness, blurs, median and limit range filters, and 3) the specific values for each filter applied in peak finding programs.
I have examined one trimer plot, mirrored and rotated, with separate traces, and each of those transposed 180o in excel and reapplied peak finding programs.
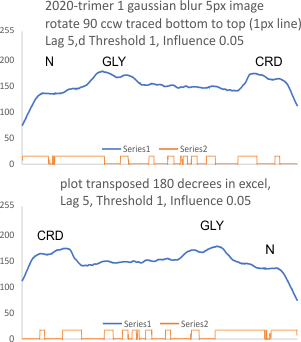
There is some variation, yes, but pretty small, not the big changes like i expected to see. Plots below are a sample comparisons of how peaks are detected in a “stackoverflow” method for peak detecting.
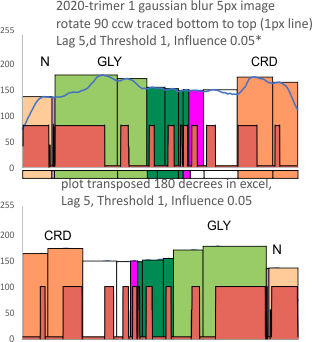
top image shows the plots, bottom image shows how the plots have been ordered (according to countless plots determining that the peak number in a hexamer is about 15, and in a hexamer half that, except for the fact that the N term peak number does change. That is something that will be interesting to figure out. Changes are small… but my purpose was to see whether the “tiny peak” on the slope of the N term peak would be more prominently identified if plots did not have the large N term peak just prior. That has worried me for a long time….. that tiny peak is clearly there but rarely counted. (it is marked by purple below). The reversal of this plot did not change the detection of the “tiny” peak.

