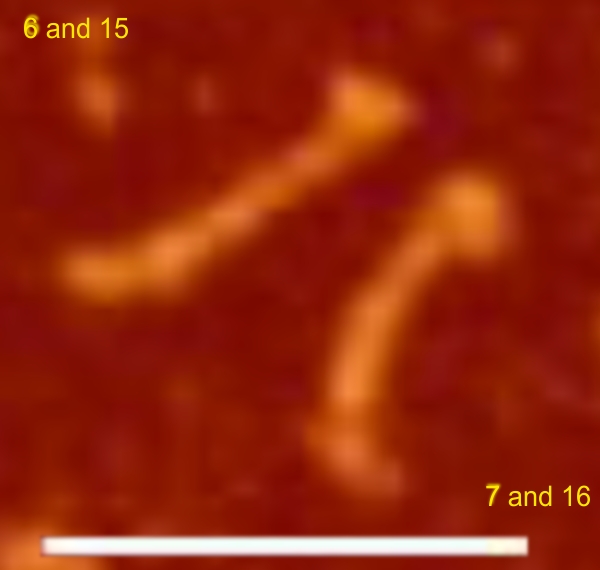
Two SP-D molecules, two different published images, two different image processing programs, 6 different signal processing functions — an attempt to see whether apps and image resolution cause huge differences in brightness peak determination using tracings through the middle of an AFM image, traced from N to CRD (in that direction, left to right, 1px line using ImageJ).
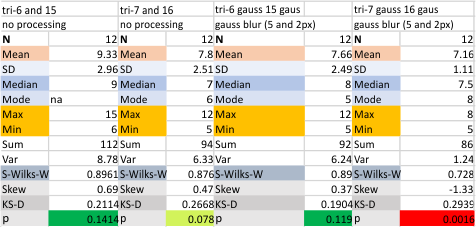
The summary below does not distinguish between signal processing apps…. the 6 different peak finding apps are summed into one value with the image processing filters. There is an N of 4 (two molecules, one set, trimers, 6, 7, 15, 16 with no processing, and one set (the same 2 molecules filtered with a gaussian blur (trimer 6 and 7, gaussian blur 5px — trimer 15 and 16 gaussian blur 2px). The no processing image was lower resolution, the second set was an image at higher resolution. Both sets were plotted for brightness peaks.
The two trimers are seen below. A total of 48 peak finding plots, 6 plots each trimer with no-processing, 6 plots each trimer with gaussian blur filtering. Trimer 6 and 15 are the same molecule, different images, as are trimers 7 and 16 the same molecule, different images.
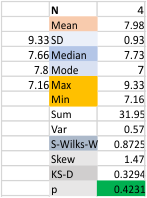
 In the summary below, data for the same molecule were combined (6, and higher res duplicate 15)( 7 and higher res duplicate aka 16). Two categories of image processing (no processing, and gaussian blur) were applied. Both molecules traced with “no processing” showed higher peak numbers (likely due to greater pixelation of the images. Gaussian blur even when sparingly applied decreased peak number.
 However the mean of the group (7.98) is supports the idea that there are 8 peaks per trimer. This is what has been seen consistently using all 6 signal processing functions (all at the same settings) for peak finding.
