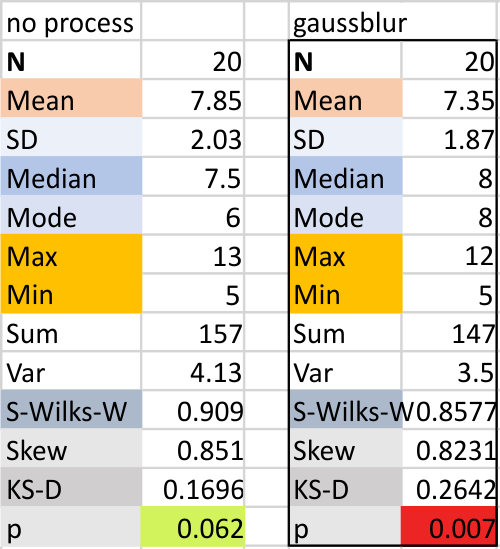
Two SP-D molecules, two different published images, two different image processing programs, 6 different signal processing functions (continued). Using only the peak finding functions (from the various programs listed in previous blog posts), one or two tailed t-test say there is not a significant difference in the number of peaks found between the “no processing” set, and the “gaussian blur” set of plots. Column on left is no processing, column on right is gaussian blur.

Specifics of the plots used in the analysis above is given below. Trimers are the same ones picture in the previous blog. This set of data has NO counts made by me from the image, only counts made from the plots made in ImageJ then subjected to various peak finding programs. The molecules represent a pair, which were in two different images, and at two different resolutions. No difference in the process was found between these two sets.
The total number of peaks is a little bit shy of what of what i think they should be (that is, N=8 peaks) but the comparison here is one to see what impact the original image has on peak counting outcome.
