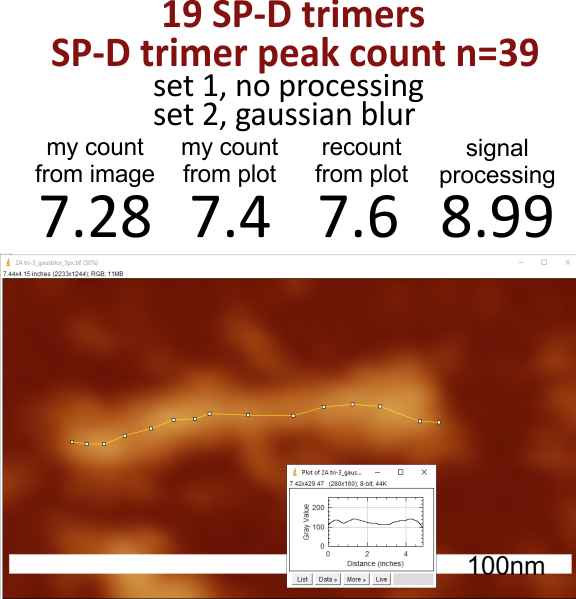
Bright peaks (grayscale 0-255) counted along a segmented line drawn linearly (see image for one such actual trace) through the middle-width of images of SP-D molecules (AFM) show that the “number” of peaks will likely be a match for similar assessment of peaks along a hexamer, that is 8 peaks which is a number that exceeds what has been published so far by 5 additional peaks. The data below is for two sets of peak counts of (17+2 – the latter are duplicates from a different image), the first set without processing, the second set with gaussian blur. Typically the blurs were exceuted at the minimum level to reduce pixelation in the images. Most common blur was 2px, next most common, 5px, and in one case a 10px blur was applied.
Peaks under the column of signal processing include 5 functions, frequently mentioned, and with identical settings described before where peak count was strictly adhered to, though sometimes the peaks identified by those functions were difficult to comprehend. Some peaks overlooked, some over reported (LOL) but those data were not changed.
my new favorite quote (since learning about signal processing) was given one post before…
“all models are wrong, but some are useful”
