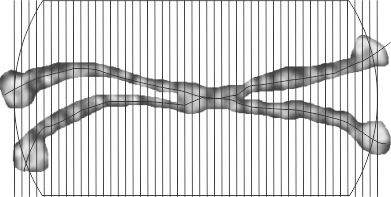
This might end up providing clues as to where the center of the dodecamer divides the arms on the acute angles. It relies on a common point counting method in morphometry and the readings on grey scale measurements using imageJ. It will take some handwork, no question, if you know an more automated way. please advise.

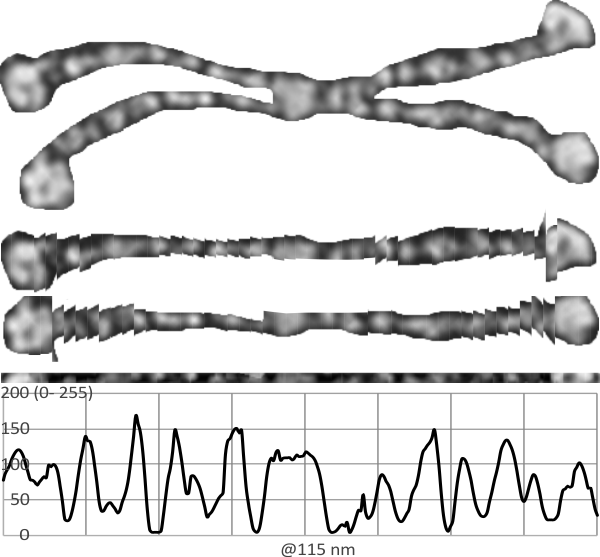
Another option worked on today is to cut the molecules and moving the parts into a straight line, then cutting a small band through the center where the variations in grey scale are found and using ImageJ to plot the grey scale values, setting up a plot in excel and using that under neath the visual. I used photoshop at half transparency to put the right arms and left arms over each other and increasing the contrast of the two, then flattening the image and exporting a tiff to open in ImageJ. The best rectangle through the dodecamer then is a blend of the two arms on the 45 degree angles (purposefully to see if there is a size and density pattern to the center part of the dodecamer that might shed light on how many of the amino acids in the collagen-like portion are involved there.
The same dodecamer as seen above, is the top image, then the “straightened image (i used about 25 cuts per arm) is shown for the two by two arms of the dodecamer below, and the blended half transparent flattened image is the the thin band just above the grey scale density plot. Clearly there is a central area….matching that in the top image, it will take some additional images to find out whether the peaks along the arms are consistent or just random. One thing for sure, this plot does NOT show the definite bands that the image from Arroyo et al did. I see that they used one particular image and this one i will test next.

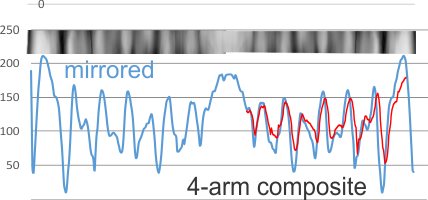
 Adding to this is a sample from which all four arms are leveled out using corel draw and/or photoshop and aligned to a common length (CRD to N terminal) relative to each other, with two arms mirrored so that all CRD are pointing the same direction, each image overlay was taken to 80% or so transparency, the image flattened and a exported as a tiff and then opened in ImageJ for a grey-scale intensity plot. The two plots (upper one that is two arms blended in a dodecamer, and lower one, 4 arms blended and mirrorred) still give the impression that the peaks are related to the density of the particles shadowing the molecule. THe clearest differences are found in the size of the most central part of the N terminal and the outer globs of the CRD. It is possible that NO pattern can be determined from this approach.
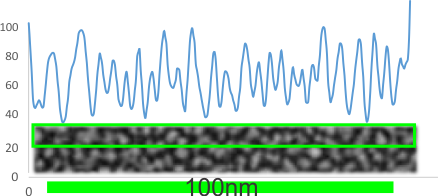
The best test for the background is to do some plots on areas that are adjacent to each of the molecules.
He is one such LUT plot for a background from the same group as is dodecamer above and the magnifications are relative to each other. The background has a 25 or 26 peak to peak distance in 100nm where the molecule that is shadowed has about 16, or about 5 in the images by Arroyo et al. Neither is probably correct. The peak height in the background is not the same as the dodecamers either, though images were not manipulated together, so that is another control to do.
