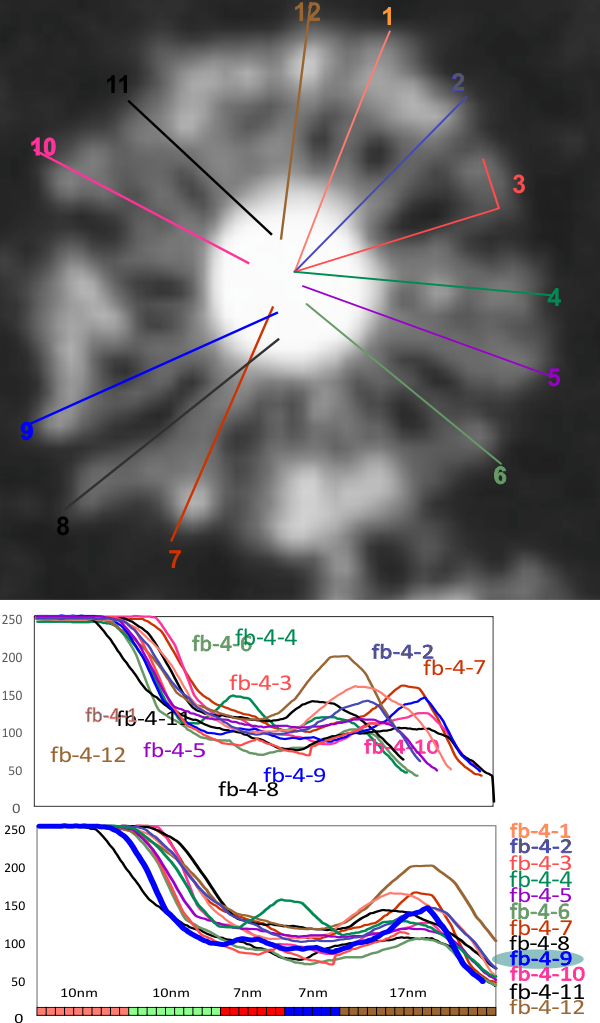
I have shown two LUT plots of straight lines in the arms of 12 of the “likely” 18 arms of this SP-D multimer (would that I had access to better images… but I am having a difficult time finding original images or receiving donations for me to analyze. However, these plots (original in terms of length for the top graph and rendered to 50 nm for the bottom graph then divided according to nm does show pretty much the same distribution for the LUT peaks as the dodecamers (i chose the blue plot (arm 9 of this dodecamer (you can see which one is arm 9 in the black and white AFM at the top) as it showed the small peaks in the collagen-like region and what is typical of multimers, a totally blended very white (grayscale at 100% or 255 which ever way you plot the grays — left most peak (that ends in the center (per the lines drawn on the fuzzyball)). The width of the CRD stays pretty close to the dodecamer values (right-most peak on two bottom graphs). Considering how fuzzy the original AFM image was/is, these plots remain consistent with the 5 peak per arm motif for SP-D arms.